
Gold price started a fresh surge above $4,800 and traded to a new all-time high. Crude oil is recovering and might rise toward $61.20.
· Gold price rallied to a new all-time high and traded above $4,845 against the US Dollar.
· A key bullish trend line is forming with support at $4,775 on the hourly chart of gold at FXOpen.
· WTI Crude oil is recovering losses and trading above $59.00.
· There is a rising channel forming with support at $59.40 on the hourly chart of XTI/USD at FXOpen.
On the hourly chart of Gold at FXOpen, the price formed support near $4,535. The price remained in a bullish zone and started a fresh increase above $4,600.
The bulls pushed the price above $4,800 and the 50-hour simple moving average. Finally, it traded to a new all-time high at $4,849. The price is still showing bullish signs above $4,800, and the RSI is above 80.
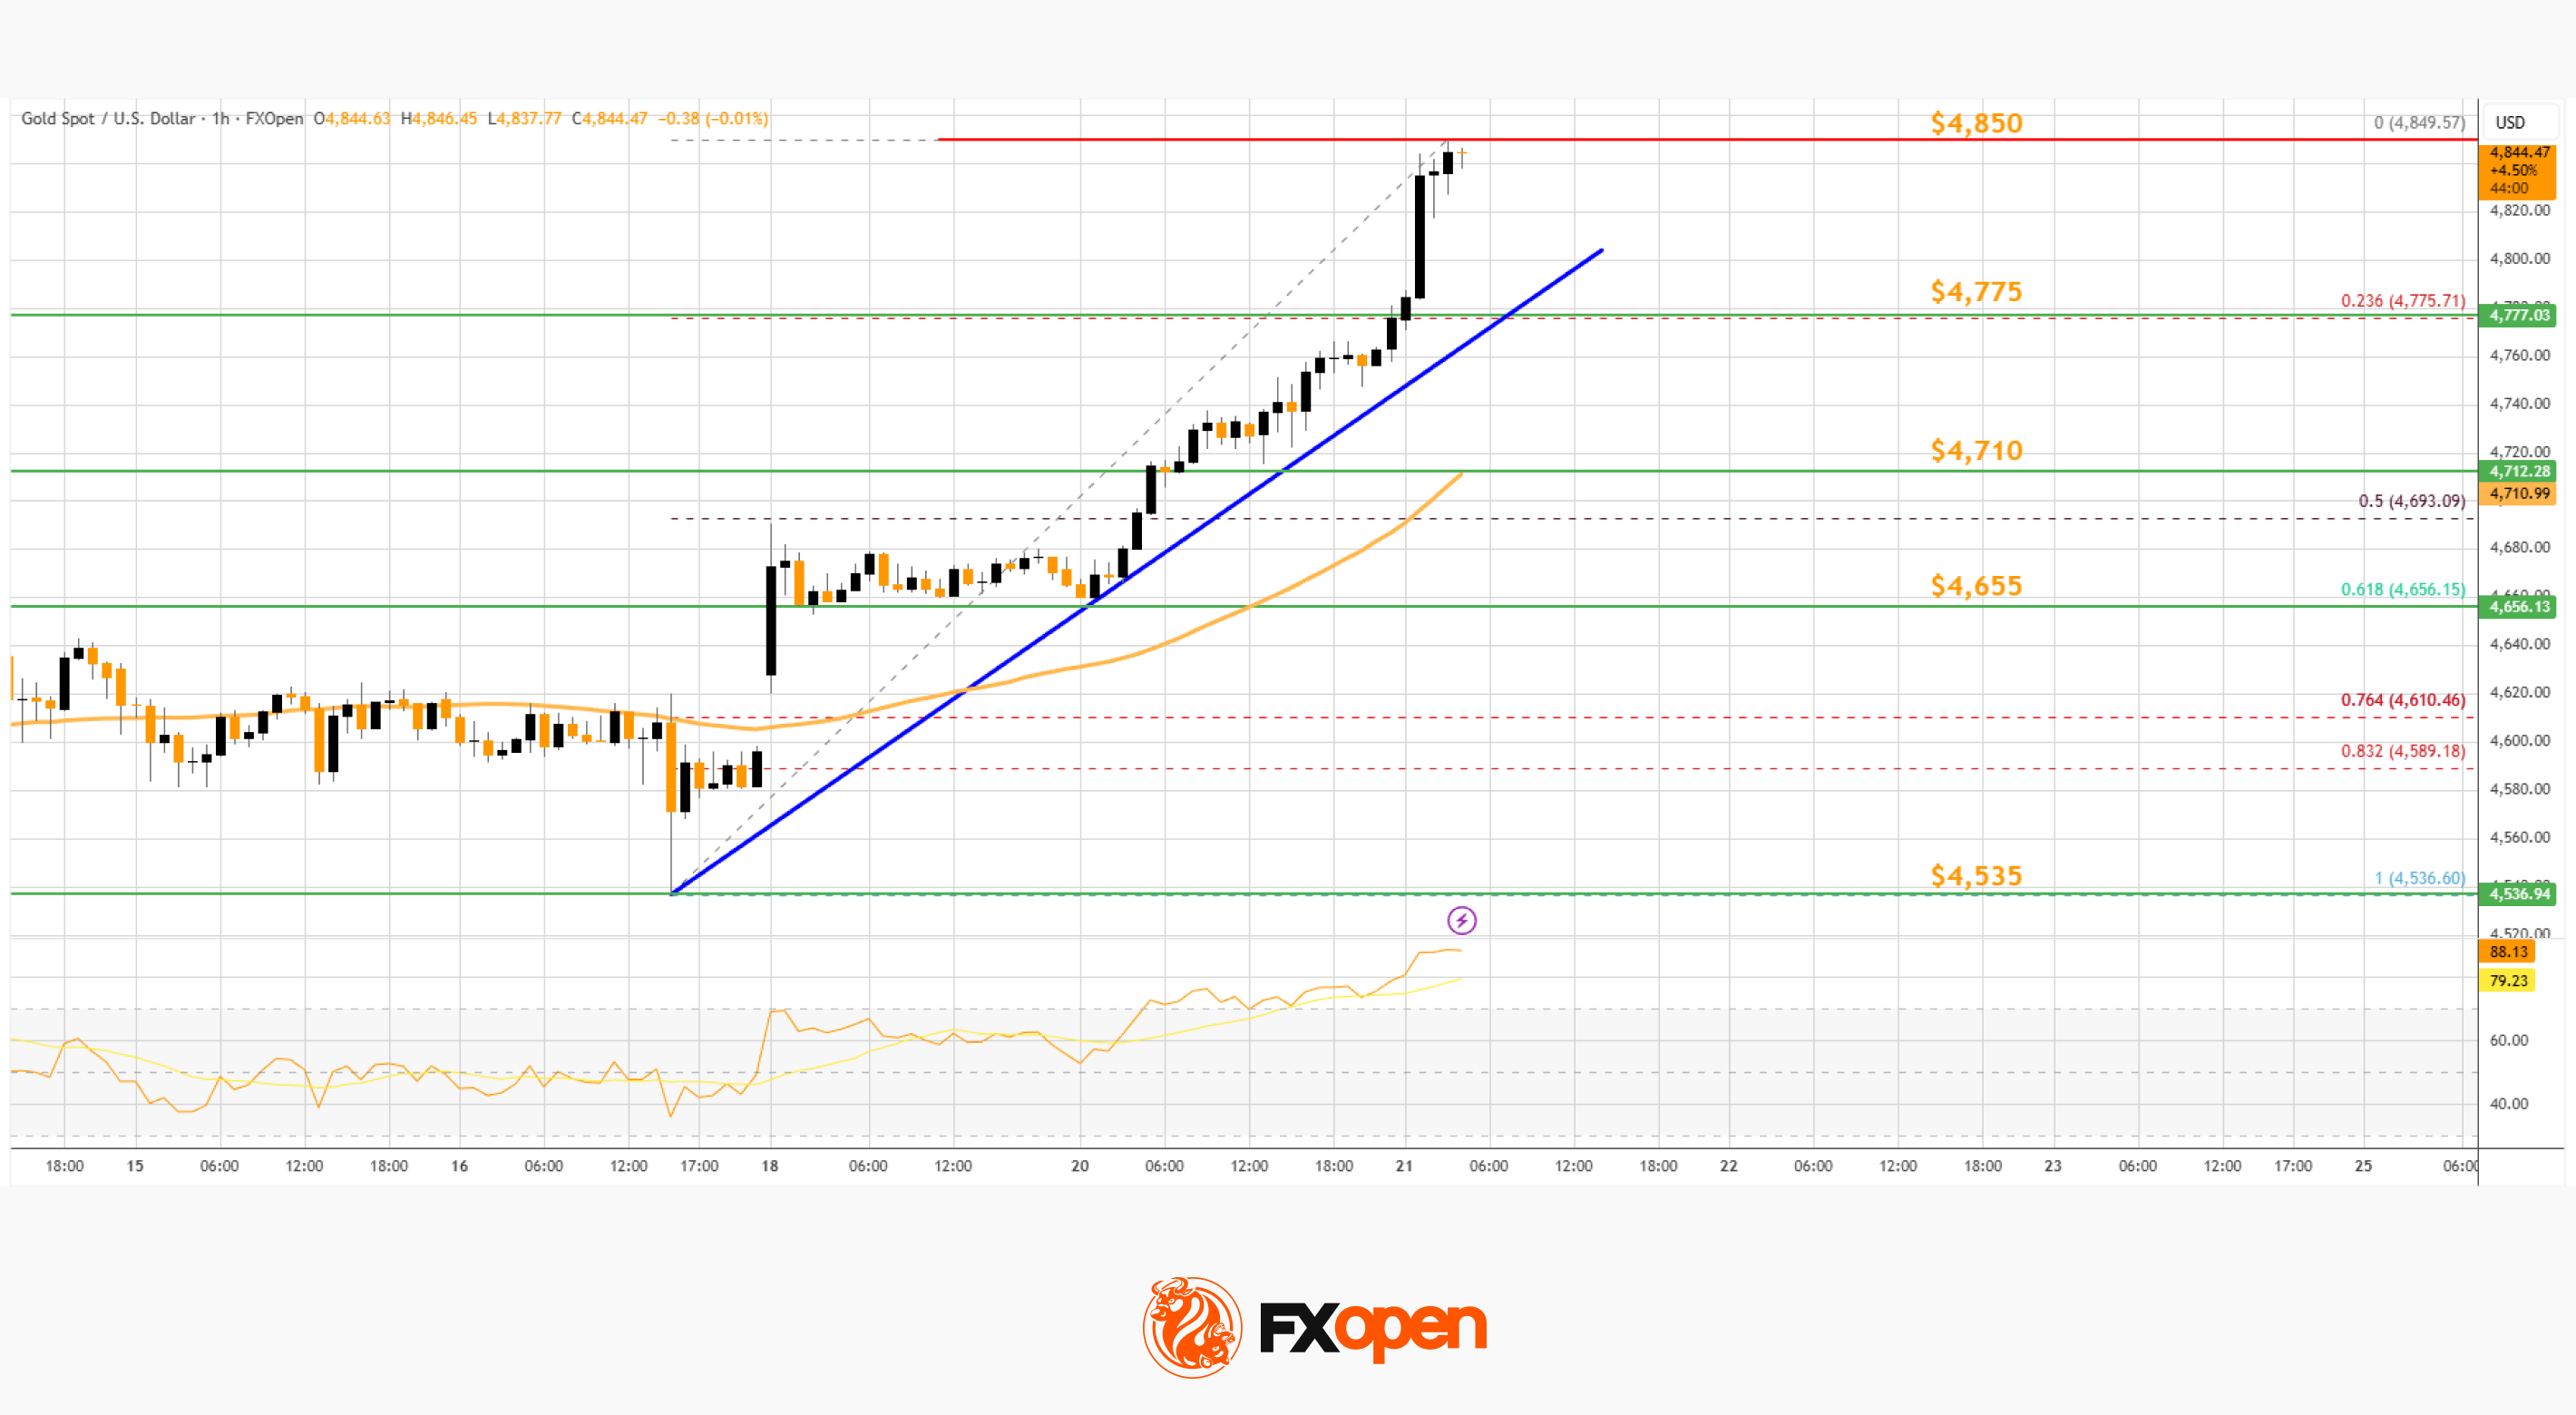
Initial bid zone on the downside could be near the 23.6% Fib retracement level of the upward move from the $4,536 swing low to the $4,849 high at $4,775. There is also a key bullish trend line forming with support at $4,775.
The next area of interest might be near the 50-hour simple moving average at $4,710. A downside break below $4,710 might send the price to $4,655 and the 61.8% Fib retracement.
If the bulls fail to protect $4,655, the price could start a larger downside correction. In the stated case, Gold could drop toward $4,535. The next area for the bulls might be $4,500. A daily close below $4,500 could spark bearish moves and send the price to $4,350.
If there is a fresh increase, the price could face resistance at $4,845. The next sell zone might be $4,880. An upside break above the $4,880 resistance could send Gold price toward $4,950. Any more gains may perhaps set the pace for an increase to $5,000.
On the hourly chart of WTI Crude Oil at FXOpen, the price found support near $58.50 against the US Dollar. The price formed a base and started a recovery wave above $59.00 and the 50-hour simple moving average.
The bulls were able to push the price to the 50% Fib retracement level of the downward move from the $62.17 swing high to the $58.53 swing low. Besides, there is a rising channel forming with support at $59.40.
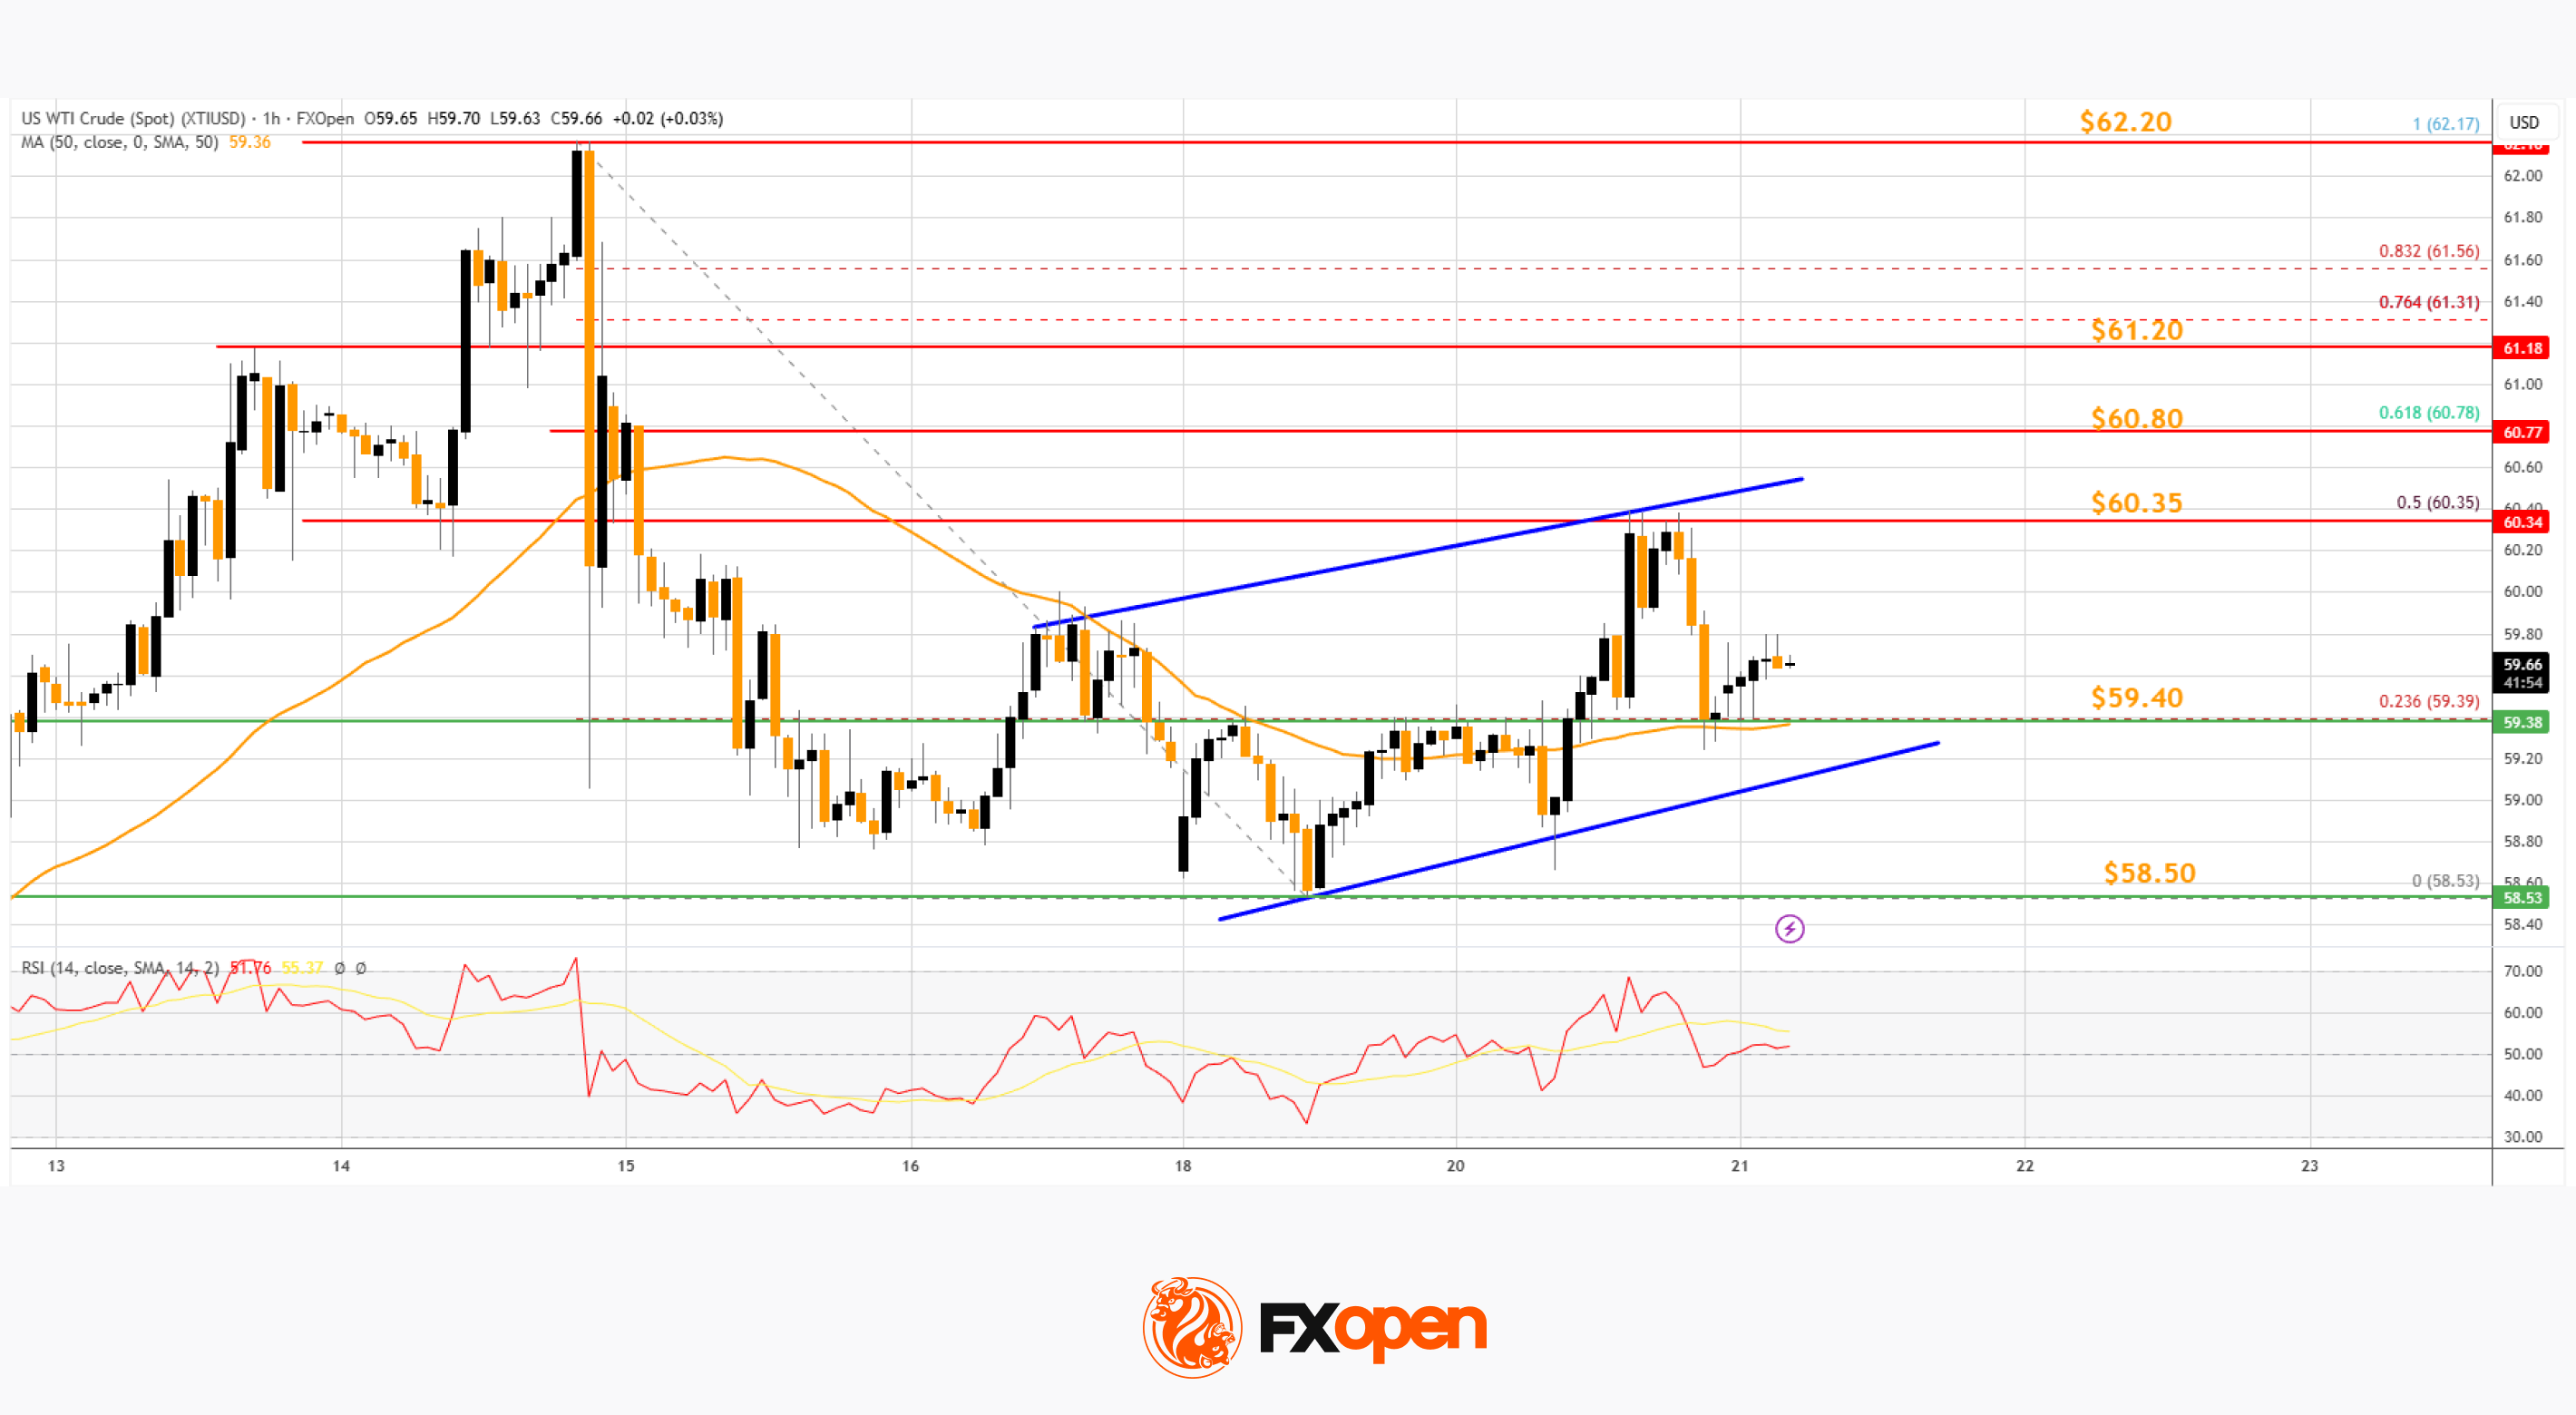
The hourly RSI is above the 80 level, and the price is currently consolidating below the $60.30 barrier. The next hurdle could be $60.80 and the 61.8% Fib retracement.
A clear move above $60.80 could send the price toward $61.20. Any more gains might open the doors for a test of $62.200. Conversely, the price might start a fresh decline from $60.35 or $60.80. Immediate support sits near $59.40 or the 50-hour simple moving average.
The key breakdown zone on the WTI crude oil chart might be $58.50. If there is a downside break, the price might decline toward $58.00. Any more losses might encourage the bears for a push toward $56.50.

