
Gold prices started a fresh increase from $4,400 and moved above $5,000. WTI Crude oil prices are gaining bullish momentum and might even test $65.00.
· Gold prices started another increase from $4,400 after a sharp decline.
· A connecting bullish trend line is forming with support at $5,000 on the hourly chart of gold at FXOpen.
· WTI Crude climbed above the $61.50 and $62.00 levels.
· There is a key bearish trend line forming with resistance at $64.65 on the hourly chart of XTI/USD at FXOpen.
On the hourly chart of Gold at FXOpen, the price found support near $4,400 after a massive selloff. The price formed a base and started a fresh increase above $4,800.
The bulls cleared the $5,000 barrier and the 50-hour simple moving average. There was also a move above the 50% Fib retracement level of the downward move from the $5,595 swing high to the $4,402 low. The RSI is now above 50, and the price could aim for more gains.
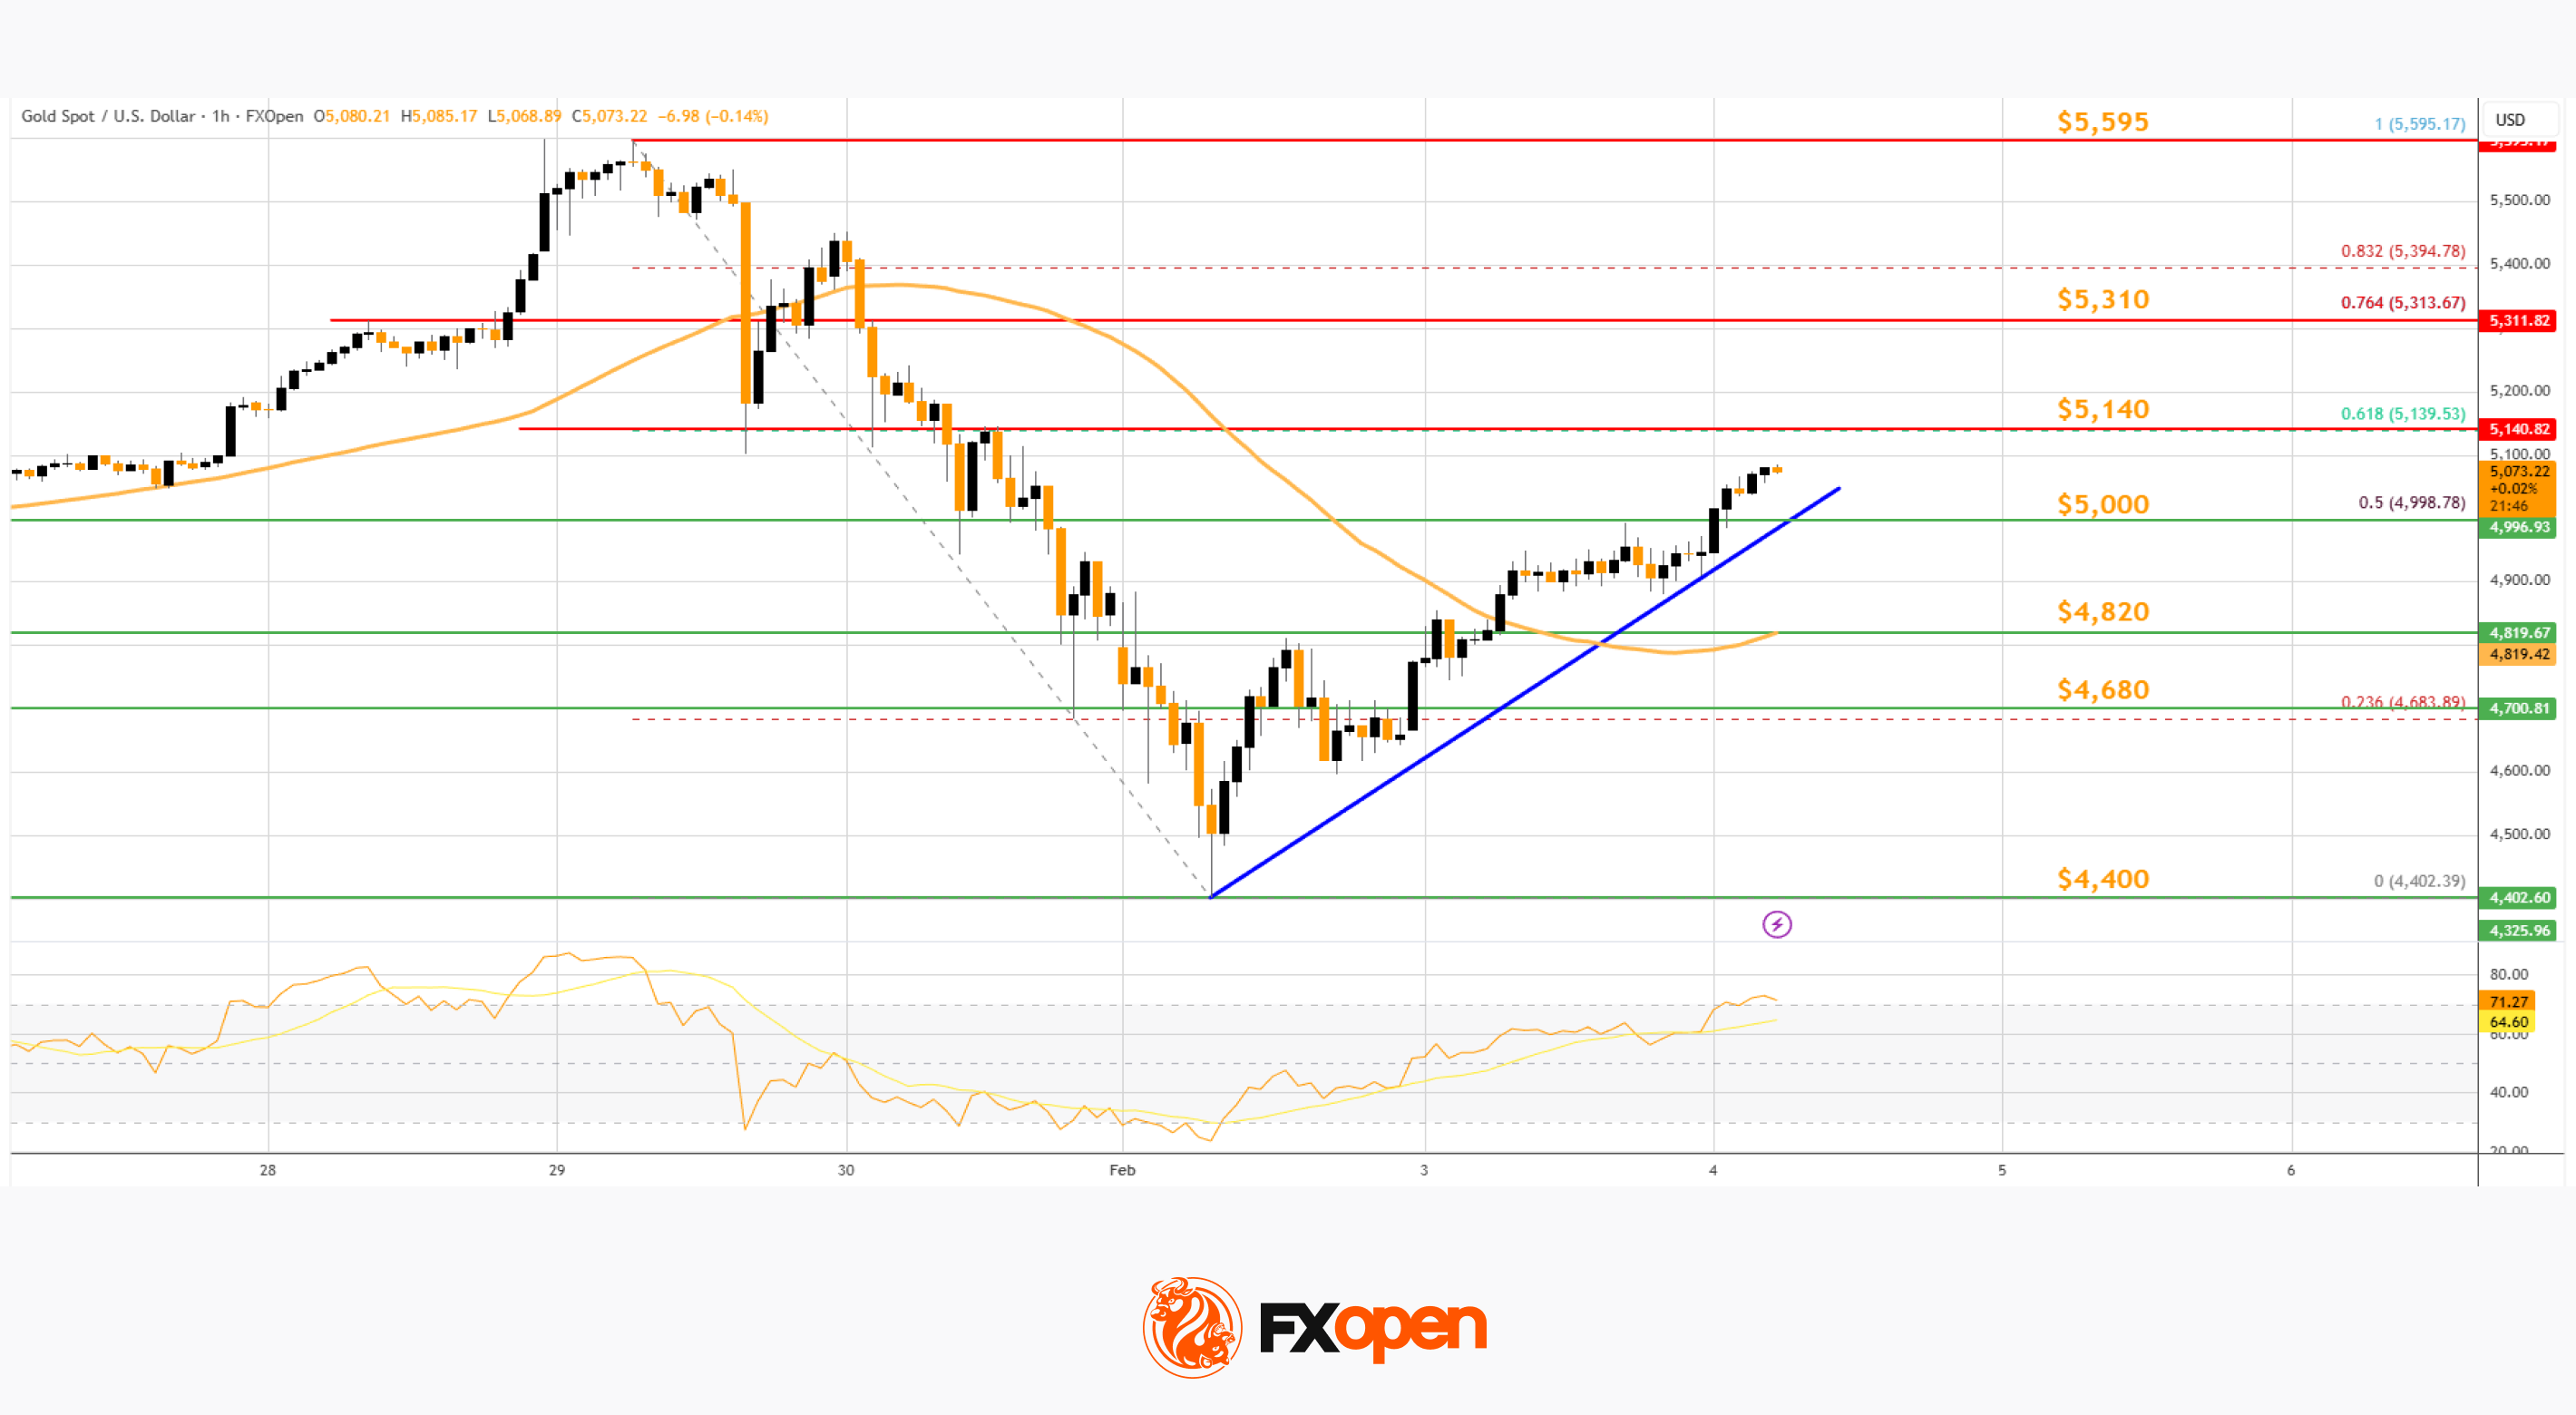
An immediate hurdle is near the 61.8% Fib retracement at $5,140. The first key area of interest might be $5,310. An upside break above $5,310 resistance could send Gold toward $5,500. Any more gains may perhaps set the pace for an increase toward the $5,595 high.
An initial bid zone on the downside is near a connecting bullish trend line at $5,000. If there is a downside break below $5,000, the price might decline further.
In the stated case, the price might drop toward $4,820. The next key zone for the bulls might be $4,680. Any more losses might send the price toward $4,400.
On the hourly chart of WTI Crude Oil at FXOpen, the price started a fresh upward move from $60.85 against the US Dollar. The price gained bullish momentum after it broke $62.00.
The bulls pushed the price above the 50% Fib retracement level of the downward move from the $65.83 swing high to the $60.84 low. The price even climbed above the 50-hour simple moving average. The price is now facing hurdles near the 61.8% Fib retracement level at $63.90.
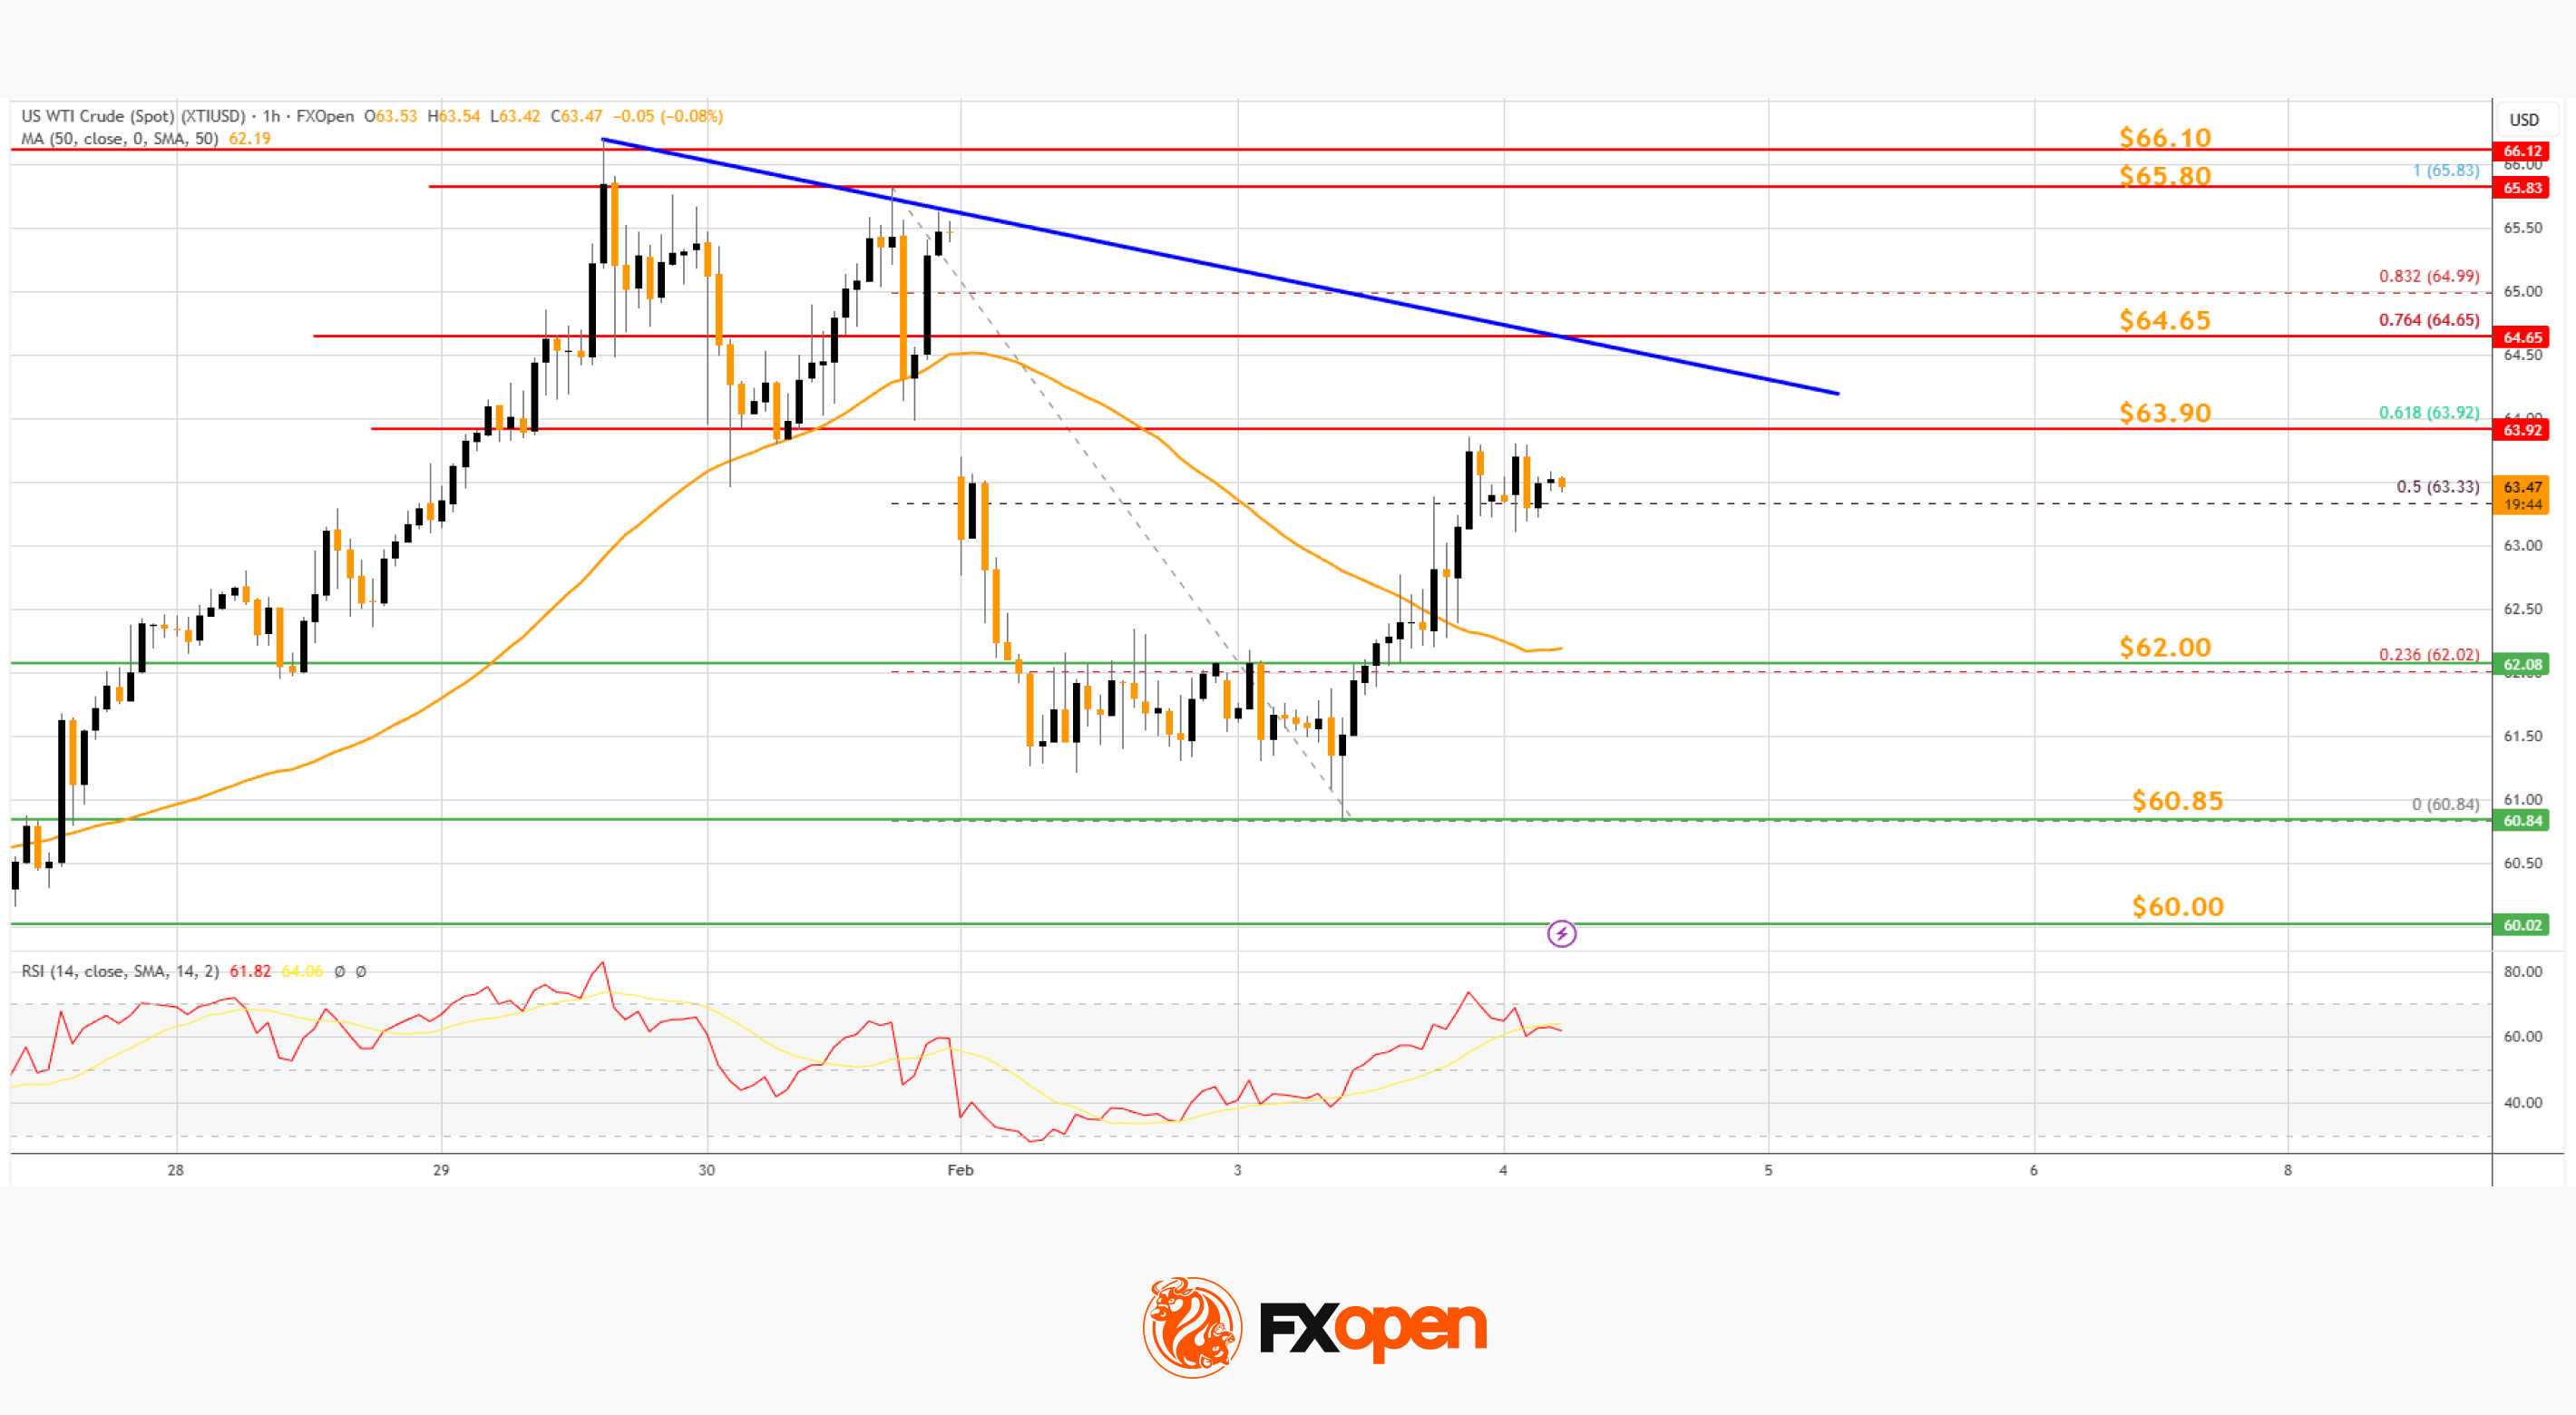
The RSI is now near the 60 level, and the price could aim for more gains. If the price climbs higher again, it could face resistance near a key bearish trend line at $64.65.
The next major hurdle for the bulls sits at $65.80. Any more gains might send the price toward the $66.10 zone or even $67.20. Conversely, the price might correct gains and test $62.00.
The next major breakdown zone on the WTI crude oil chart is $60.85, below which the price could test $60.00. If there is a downside move below $60.00, the price might decline toward $58.50. Any more losses may perhaps open the doors for a move to $55.00.

