Hedera (HBAR) is currently trading at $0.2405, and it has decreased by 0.56% over the past 24 hours. Market activity has also been weak, and the trading volume has fallen by 28.39% and is currently standing at $209.04 million. This drop provides evidence of a dilution in short-term momentum and indicates less involvement of traders.
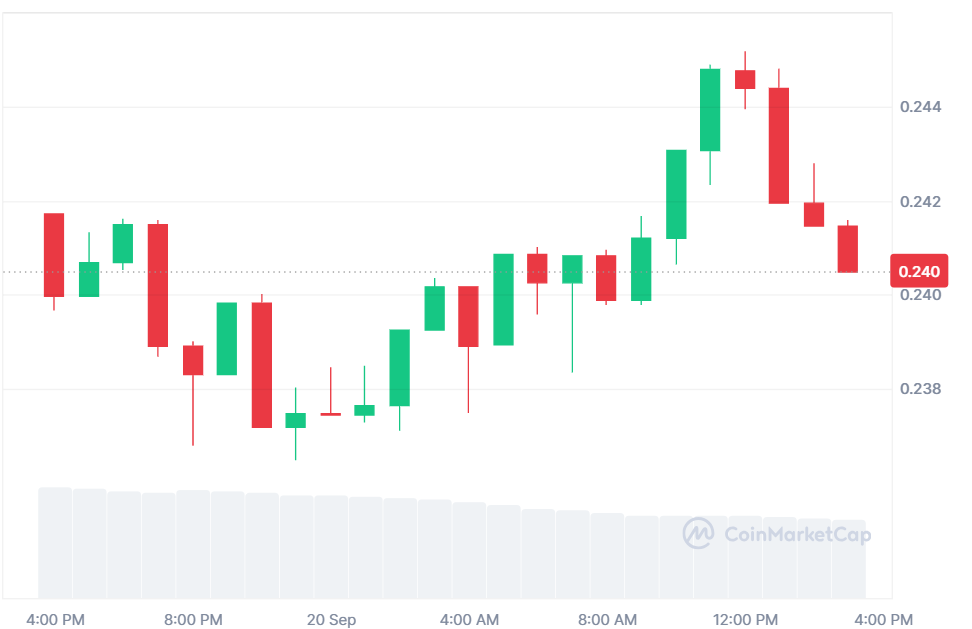
Source: CoinMarketCap
HBAR has been performing on the negative side in the last seven days. The coin has lost 4.33 percent of its value over this time, and this is a general market drive and a consistent falling trend. Investors are keeping a close eye on the coin as it tries to survive in the prevailing market conditions.
Crypto analyst Jonathan Carter highlighted that HBAR is developing a bullish flag on the two-day chart. The coin has been trading in a tight range over 35 days. Price action depicts consistent compression, where the 100-day moving average is providing strong support. Such a consolidation is an indication that the market is on the verge of making a decisive move.
Analysts believe that a breakout might be soon forthcoming. As the momentum goes up, the price will move towards 0.29, then 0.39, and potentially 0.55. These levels are major upside targets in the case that buyers take over. The configuration underscores the increasing expectations, with traders closely monitoring the next direction.
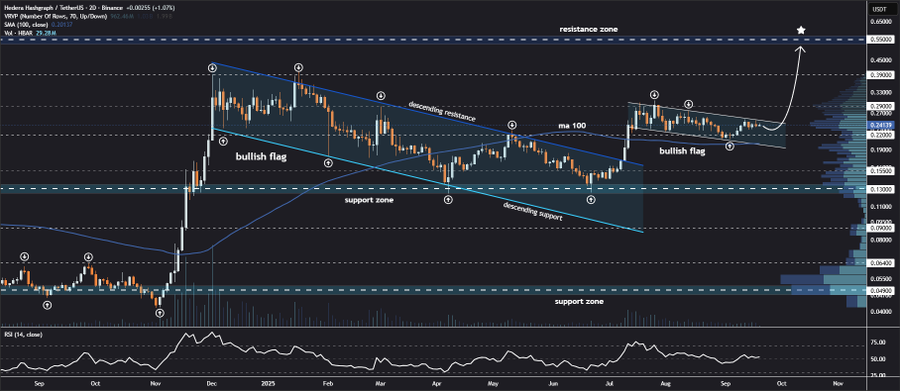
Source: X
The Relative Strength Index (RSI) stands at 52.86, which is above the 50 mark. This indicates an equilibrium in the market without any overbought or oversold effects. The purchasing power and selling power stand in the same position at this point. The indicator provides space in which price can go either way or not depending on volume support.
Also Read: Sei Price Prediction: Can SEI Break $0.49 Resistance for a Rally to $0.89?
The Moving Average Convergence Divergence (MACD) also displays a weak bullish movement. The MACD line is at 0.00197 and is above the signal line at 0.00040. The histogram shows a small number of green bars, which indicate initial positive momentum. This arrangement indicates that the mood is gradually getting better, but the relocation is still delicate without the higher demand.
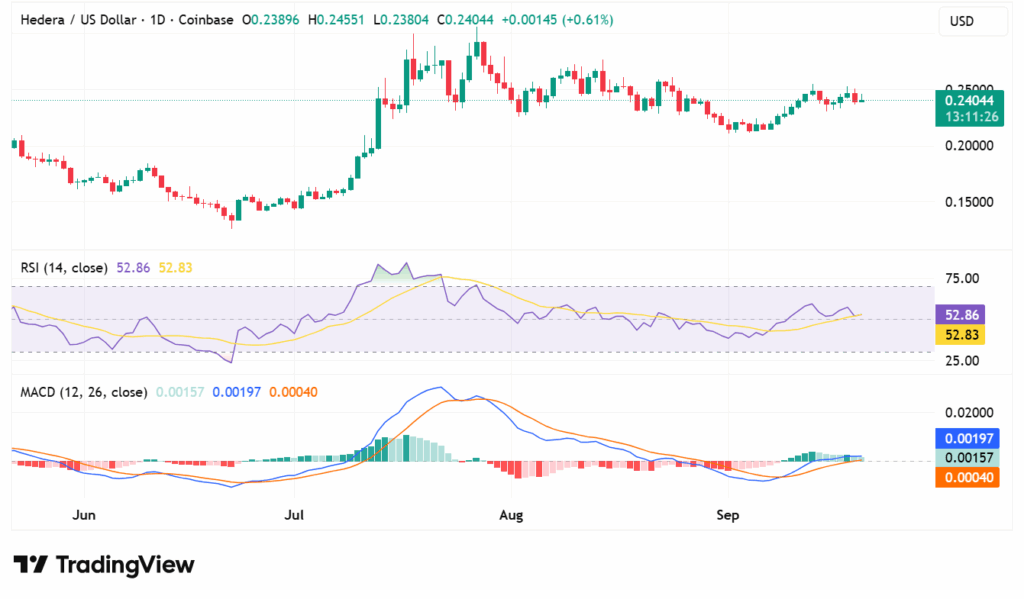
Source: TradingView
According to CoinGlass data, the trading volume of HBAR has declined by 15.67 percent to $364.00 million. Open Interest also declined 4.33%, to $420.46 million. These values indicate a decrease in market speculation. The falling indicates that traders are retreating as the momentum decelerates.
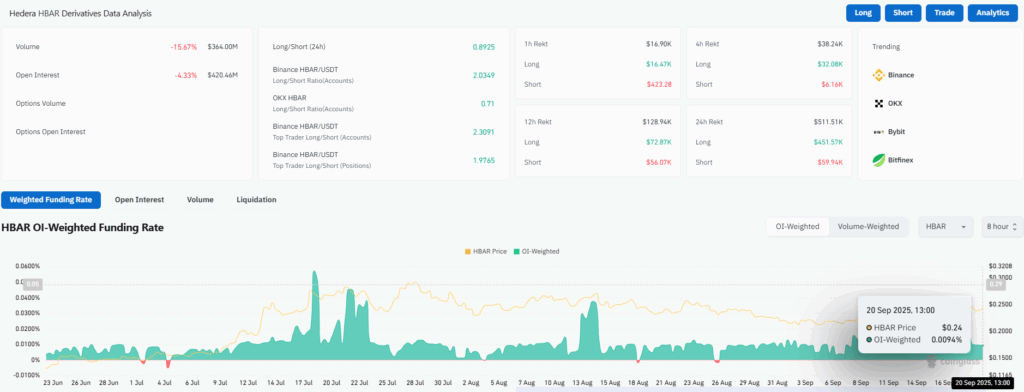
Source: CoinGlass
The OI-Weighted Funding Rate stands at 0.0094%. This stability indicates stable positioning in derivatives markets. The figures, along with the reduced volume and interest, serve as a warning to participants. The momentum in the market seems to be suppressed as traders anticipate a more specific trend.
Also Read: Ethereum on the Edge: Will $4,630 Spark the Next Explosive Rally?


