
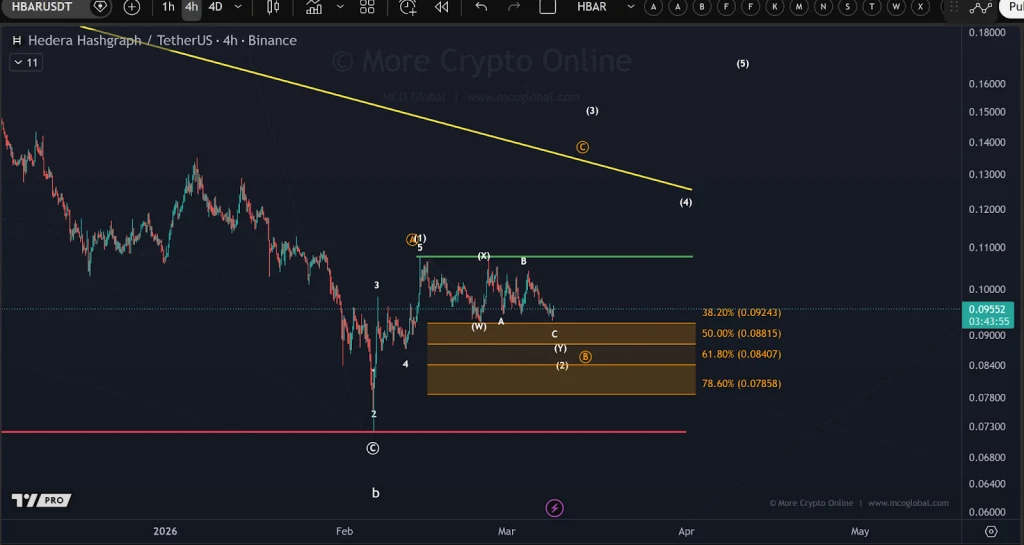
Hedera (HBAR) appears to be forming a WXY corrective pattern on Monday, March 9, a technical structure indicating extended market consolidation.
According to the data from More Crypto Online, this pattern suggests the token is experiencing a series of swings rather than a clear trend. Investors remain cautious, as the market’s current behavior reflects uncertainty and a lack of decisive directional momentum.
Currently, the token has not confirmed a durable bottom. Price continues moving sideways within the WXY structure, highlighting the potential for further consolidation.
Traders should note that this phase could persist for some time. The ongoing oscillations indicate that additional downside remains possible, and market participants must remain vigilant before assuming the asset has stabilized.
Also Read: HBAR Approaches Make-or-Break Zone with $0.098 in Bearish Crosshairs
More Crypto Online has identified the green signal line at the $0.107 level as an important level. A strong breakout past this level could indicate that the token is trying to build a solid base.
This could be the first indication that the market is trying to stabilize and that bullish price action could soon resume, implying that investor sentiment could be improving.
Source: More Crypto Online’s X Post
Until such time that HBAR is able to sustainably rise above the $0.107 level, the pattern remains in place. The consolidation could persist, and the chance of further declines should not be ruled out.
Traders are advised to keep an eye on the key levels of support and resistance. Caution is required, as the WXY pattern is known to last longer than expected before an uptrend begins.
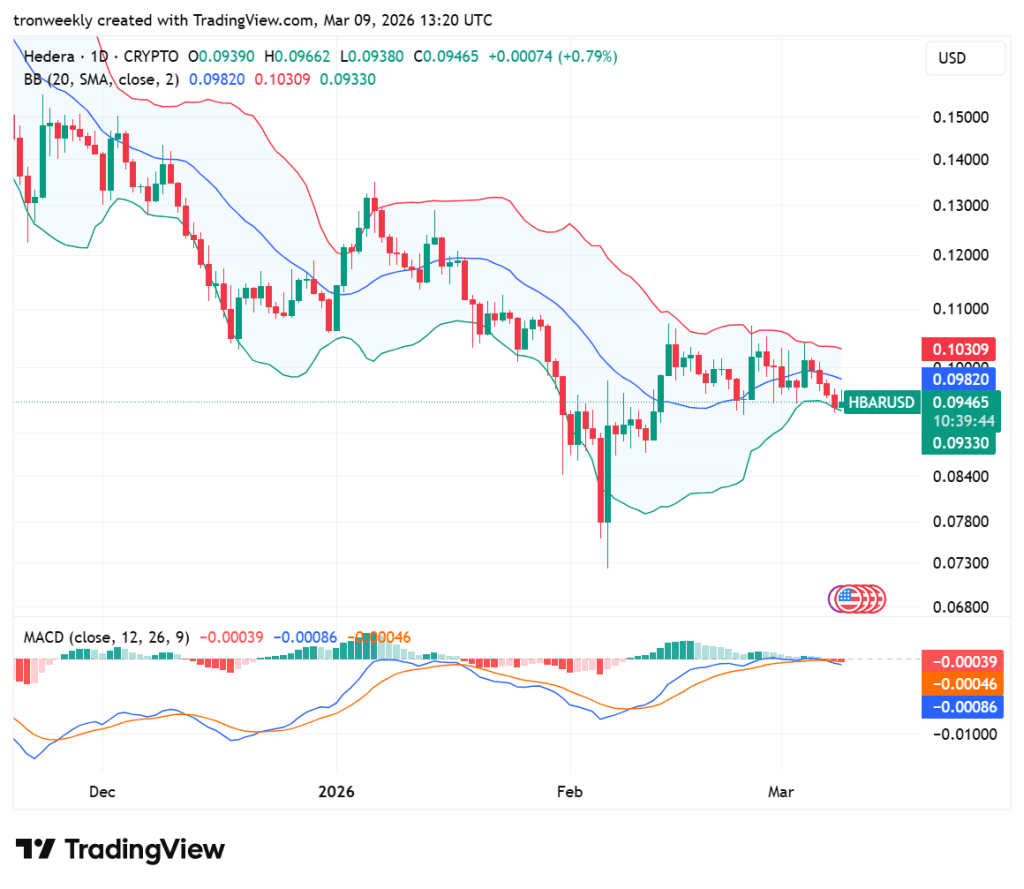
According to TradingView, as of Monday, March 9, HBAR is displaying an ongoing downtrend that has been followed by consolidation at the lower Bollinger Band.
Currently trading at $0.09465, the asset is still holding below the 20-day SMA at $0.09820. With the narrowing bands, it is clear that HBAR is at a breakout point as it tests the key $0.09330 support.
Source: TradingView
The MACD is showing decreasing bearish momentum but still has both lines in negative territory. The minor bullish cross was present earlier, but now the histogram is flattening out.
For the trend to reverse, HBAR needs to break past the $0.10309 resistance level; otherwise, the current bearish pressure could result in a retest of the February low.
Also Read: HBAR Approaches $0.30 with Volume Reaching $1.65 Billion

