Hedera (HBAR) is trading under remarkable bearish pressure with a decline in its value, in line with the overall market. The HBAR price over the last 24 hours is down by 9.98%, and over the last week it is also down by 9.55%.
At the time of writing, HBAR is trading at $0.2183 with a 24-hour trading volume of $269.3 million, up by 53.6% over the last 24 hours. The token has a market capitalization of $9.25 billion, which is slightly down by $9.25 billion.
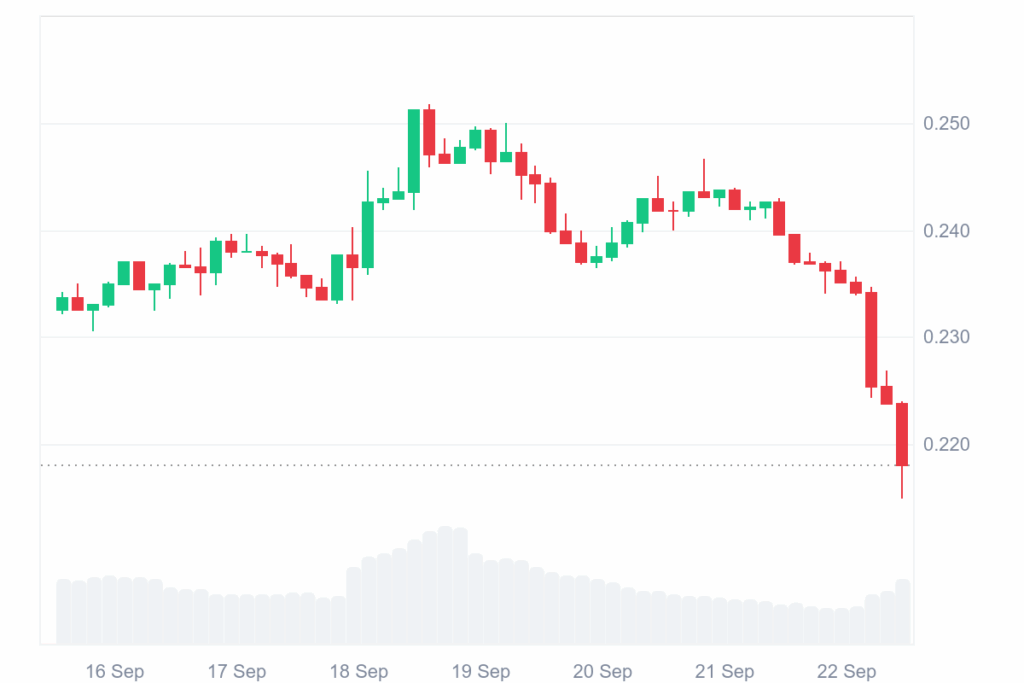
Source: CoinMarketCap
The general market trend in the crypto market has turned bearish with the decreasing investor confidence in the crypto sector. The major crypto coins have also started downward momentum, impacting the overall market, including altcoins.
Also Read: HBAR Breakout Looms as Bullish Flag Points to $0.75 Target
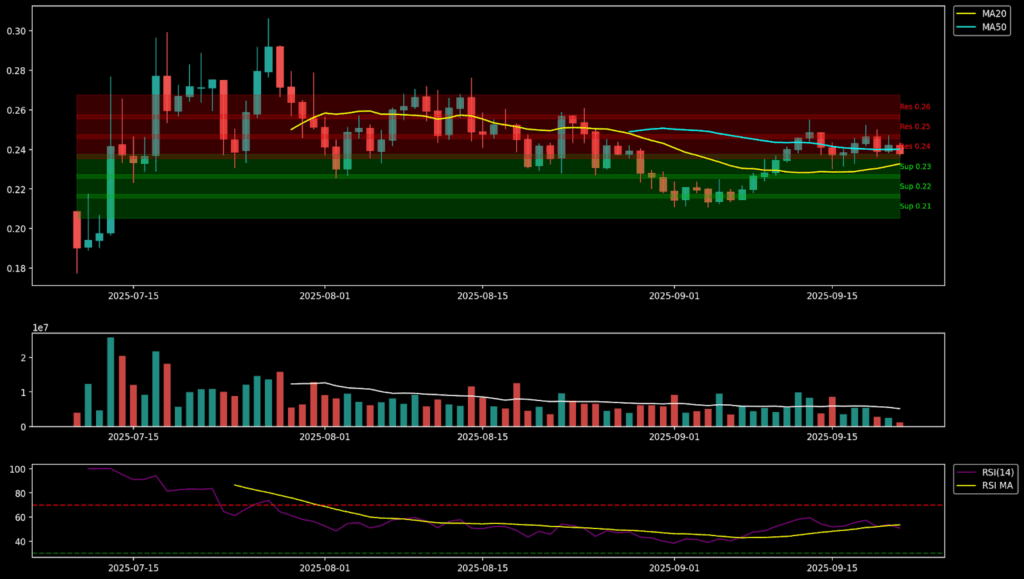
The crypto analyst highlighted that the native token of Hedera, HBAR, is range-bound between support at $0.23 and resistance at $0.26, and it has established an orderly trading band that has captured buyers’ interest. The $0.23 level has been attempted five times, and it is therefore the bulls’ most important support area. On the higher side, $0.26 still emerges as the most important ceiling following three breakout attempts.
Technical indicators provide mixed evidence, as the 20-day moving average ($0.23) drops below the 50-day ($0.24), predicting a bearish crossover. However, the RSI still sits at 51, just above neutral, and suggests momentum has not entirely turned bearish yet. This keeps the door open for either a bullish breakout or a bearish slide.
Source: X
In the near future, a breakout above $0.26 would propel HBAR to $0.28–$0.30, converting short-term resistance to support. Conversely, a drop through $0.23 would trigger an imminent drop to $0.21, at which buyers would have to re-enter to support prices. In the short term, bulls’ and bears’ pivotal battlefield remains around the $0.23 to $0.21 area.
According to the data from CryptoRank, the market action in July 2025 saw a phenomenal spike of +67.5%, one of the best monthly advances of the year, but this rally did not endure, as August witnessed a sharp decline of -12.8%, nullifying part of the earlier gain. The market displayed signs of volatility, shifting from strong growth to a steep correction within weeks.
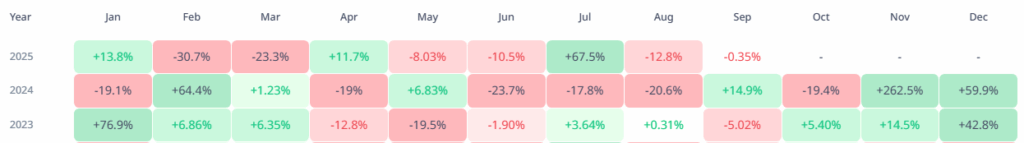
Source: Cryptorank
By September 2025, the trend continued to soften, and performance fell slightly to -0.35%. Though less essential than in August, this loss showed an ongoing inability to keep the bullish trend intact. This sequence of actions emphasized volatility, and increments in July were slowly eroded in following months.
According to the data from CMC, the sentiment in the community records a strong majority as being bullish, as 88% of respondents think prices will go up. Just 12% think the market will go down, reflecting an evident imbalance in sentiment. This bullish sentiment is based on nearly 934.7K votes, making it a significant indicator.
Source: CoinMarketCap
This type of strong bullish sentiment usually shows positive and growing confidence and positive market sentiment. When sentiment gets too one-sided, it also can show potential overconfidence risk. Traders can consider it as confirmation of strength or as indicating potential corrections.
Also Read: HBAR’s Bullish Momentum: Will It Reach $0.54 Soon?


