
Hedera (HBAR) price is showing signs of a potential recovery as the asset registered a gain on the day while the trading volume rose significantly. However, the asset’s weekly trend is still facing minor downside pressure.
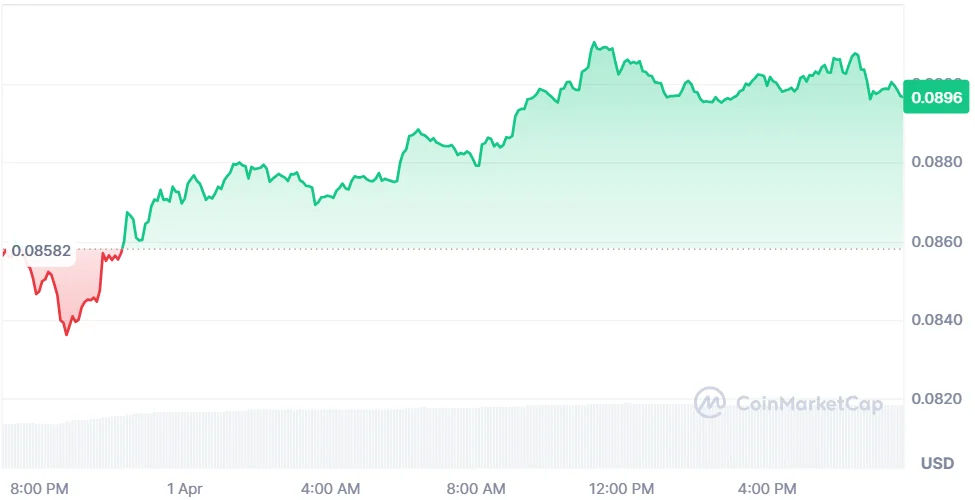
HBAR price is currently trading at $0.08966 with a gain of 5.1% in the last 24 hours. The trading volume has risen by 38.53% to $114.11 million. However, the price has declined by 5.81% over the last seven days, according to CoinMarketCap.
Also Read: Hedera (HBAR) Price Forecast: Can Price Rally Toward $0.120 Target?
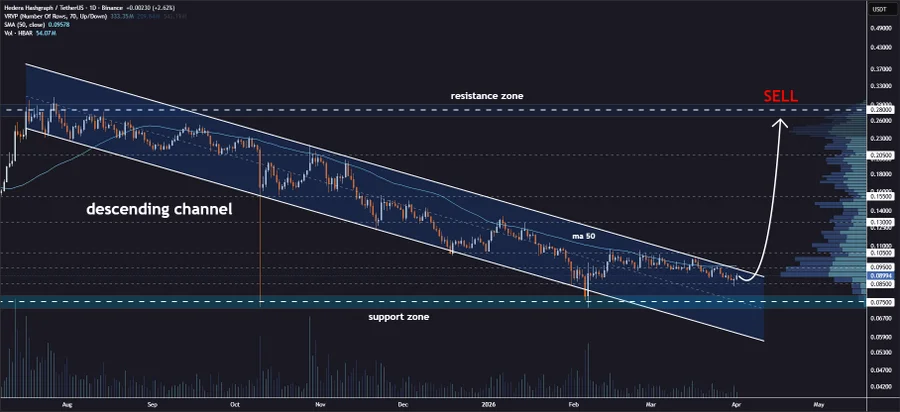
Analyst Jonathan Carter highlighted that the price is developing a breakout pattern, and the HBAR is trading inside a descending channel on the daily chart. The price is also seeing a rejection near the upper end of the channel, but the structure is still intact for a potential breakout.
The analyst also provided potential targets for the breakout, and these are $0.105, $0.130, $0.155, $0.205, and $0.280. The levels are based on the potential for a breakout and the need for the price to sustain its upward movement.
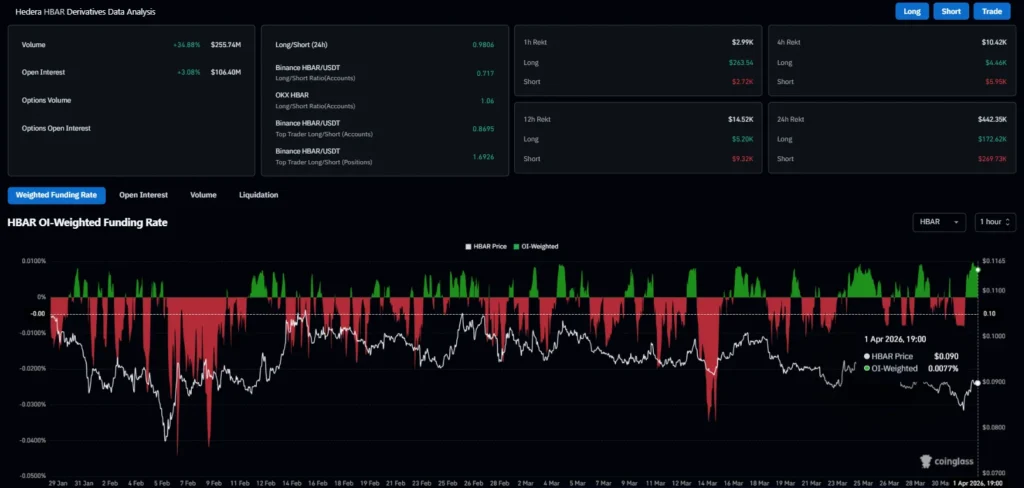
According to CoinGlass data, the future volume has risen by 34.88% to $255.74 million. The open interest has increased by 3.08% to $106.40 million. The OI-weighted funding rate is currently at 0.0077%, which indicates a slightly bullish market.
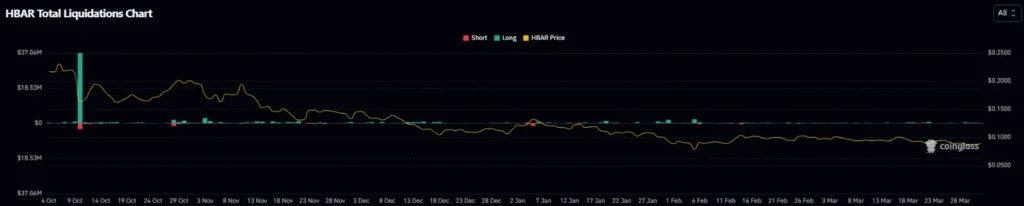
The liquidation data indicates an imbalance in the market in the last 24 hours. The total liquidations are $442.35K, while the long liquidations are $172.62K. The short liquidations are higher at $269.73K.
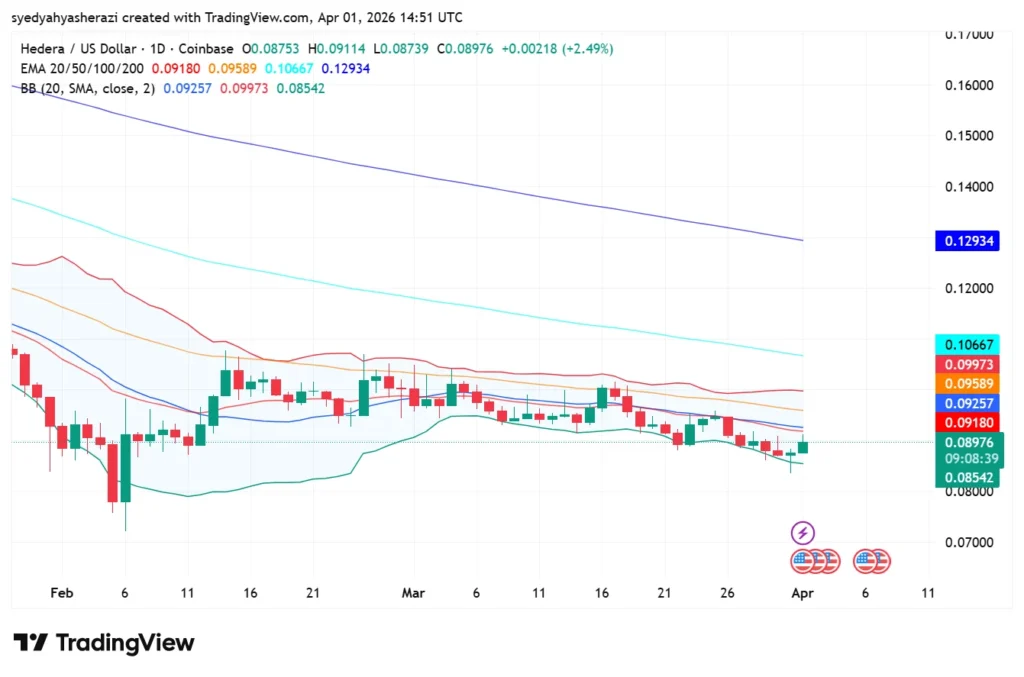
From a technical perspective, the 20-day EMA is currently at $0.09180 and slightly above the current price level. This level can be considered the immediate resistance level. On the other hand, the 50-day EMA is at $0.09589 and regarded as the second level of resistance.
The 100-day EMA is at $0.10667, and the 200-day EMA is at $0.12934, marking a long-term resistance. This shows the price of HBAR remains below key averages.
According to the Bollinger Bands, the price action is currently tightening. The upper band is at $0.09973. The middle band is at $0.09257. The lower band sits at $0.08542, and the asset’s price has recently been trading at this level.
HBAR price analysis indicates a decisive phase in the near future. The momentum is rising, accompanied by increasing volume, but the resistance is strong. The outlook depends on a confirmed breakout above the channel.
This article contains market analysis and price predictions. These are not guarantees. Crypto markets are volatile. Always DYOR. Not financial advice.
Also Read: ONDO Price Prediction: ONDO Rises on Institutional Demand, Bulls Eye $0.53 Breakout Ahead
01-04-2026
01-04-2026
555 555
01-04-2026
555 555
01-04-2026
555 555
01-04-2026
555 555


555 555