
Horizen (ZEN) is moving in a negative price trajectory as BTC has started downward movement after passing $78K, which has impacted the overall market, including altcoins. According to CoinMarketCap, the ZEN price has declined by 3.99% over the last 24 hours but remains up by 3.32% over the last week.
At the time of writing, ZEN is trading at $5.96, with a trading volume of $15.66 million, which has declined by 58.74% over the last 24 hours. However, its market capitalization stands at $107.56 million, which is also down by 3.99%.

Source: CoinMarketCap
Also Read: Aave Slips Below $30 Billion After KelpDAO Vulnerability Raises Risk Concerns
Furthermore, the crypto analyst Flippix highlighted that ZEN is showing signs of a structured bullish expansion as price action reflects steady accumulation by larger market participants.
The formation of consistent higher lows suggests growing demand, while the shift from resistance to support indicates a clear structural flip. Momentum is building gradually, reinforcing confidence that the current trend may continue strengthening further.

Source: Flippix’s X Post
Temporary retracements are not a sign of weakness but rather provide fuel to the uptrend, allowing prices to rest before moving higher.
The stair-stepping movement usually continues, failing to stop early and pointing to an extension. As the combination of pattern and momentum is in line, experts are tracking a move from $10 to $14.
According to TradingView, ZEN has exhibited great volatility by experiencing a sharp decline during February followed by consolidation.
It is currently within the Bollinger Bands, which have been narrowing due to falling volatility levels. This trend is an indication that there is a build-up of momentum that may be ready to break out.
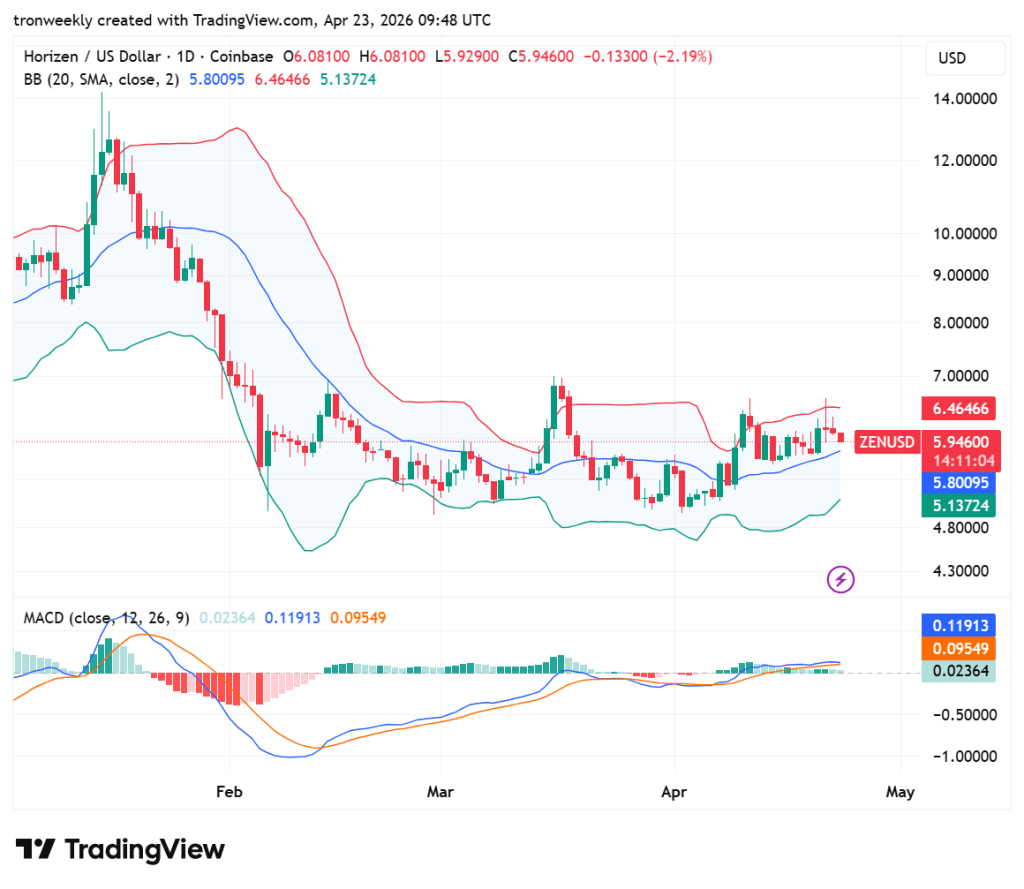
Source: TradingView
The MACD suggests a change in the market trend from negative to neutral momentum. Both lines are oscillating around zero, while the histogram is slowly drifting toward the positive side, indicating that the downward trend has stopped.
As for now, the asset lacks conviction in either direction and is floating in the uncertainty zone below its moving average.
This article contains market analysis and price predictions. These are not guarantees. Crypto markets are volatile. Always DYOR. Not financial advice.
Also Read: Solana Consolidates Near Support as Weak Momentum Caps Move Toward $90

