
Hyperliquid (HYPE) is currently trading at $49.24, having dropped by 8.84% in the past 24 hours. The fall follows an increase in trading volume of 135.65% and now stands at $544.24 million. The price is decreasing, but the activity is accelerating. The rising participation and decreasing value are both indicators of uncertainty and intense pressure throughout the market.
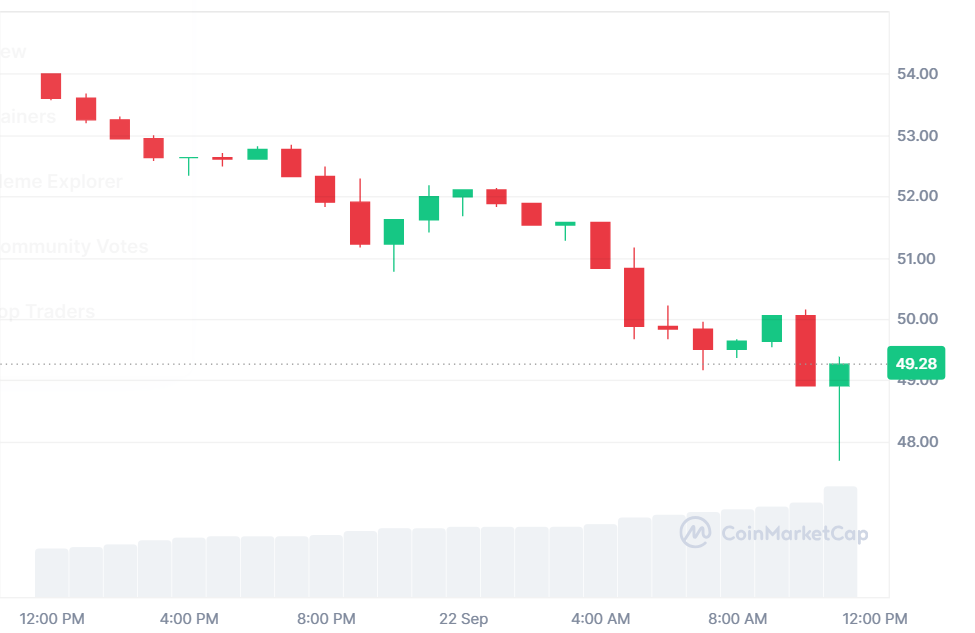
Source: CoinMarketCap
Over the past week, HYPE has been incurring losses. During this period, the token has fallen by 7.76%, indicating the continued selling pressure. Bulls have not managed to retain gains as sellers persist with the pace. The shift has put momentum in the hands of bears, and traders are wary of getting into fresh long positions.
CryptoPulse, an analyst of crypto, highlighted that HYPE failed to break out of its rising wedge, which validated bearish technical trends and led to the new selling pressure. Price is approaching the demand zone of $49.5 which is now considered a crucial pivot to short-term direction and may determine the next stage of market motion.
Analysts characterized it as a resurgence of buying power, suggesting that HYPE may need to retreat to the resistance level of $55 to $56. Nevertheless, in case of the ongoing weakness and the failure of the demand zone, there is an expectation that the price would be pushed down to the support levels of between $46 and $47.
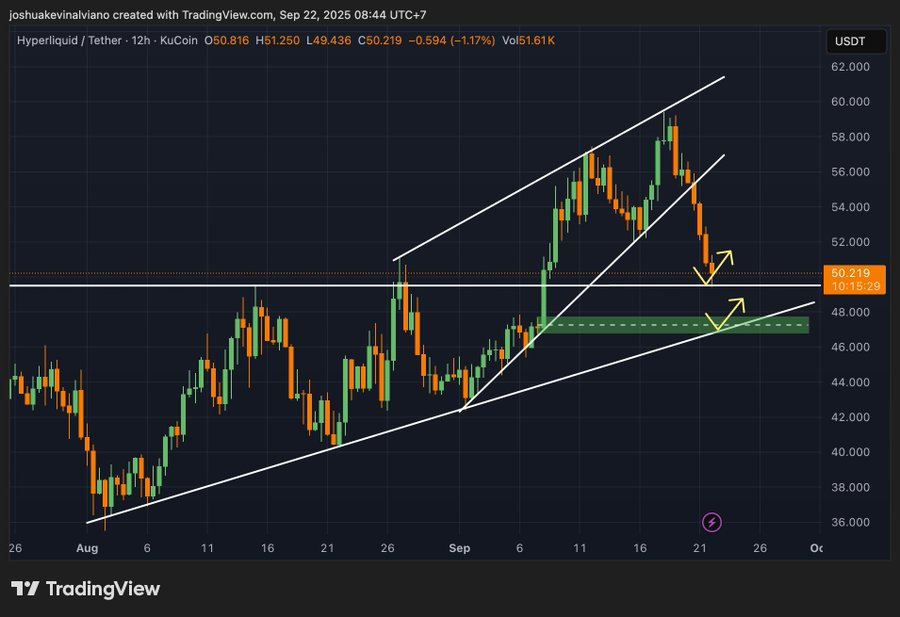
Source: X
According to CoinGlass data, the volume of trading grew 187.68% to $3.25 billion, indicating high speculative trading. The open interest decreased 3.82% to $2.27 billion, indicating that some traders mitigated risks as volume increased. The OI-weighted funding rate of 0.0581% illustrates a skewed placement, with the futures market divided into the bullish and bearish perspectives.
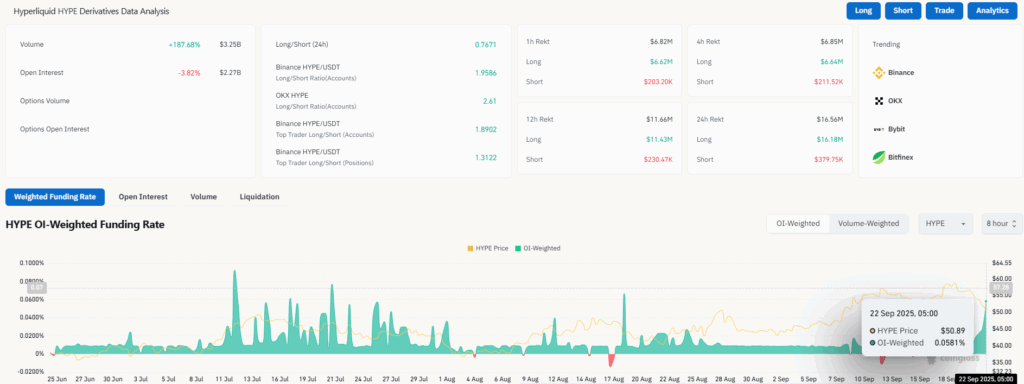
Source: CoinGlass
Also Read: ASTER Price Struggles at $1.55 Support as Whale Invests $10.5 Million
The Relative Strength Index (RSI) is at 45.73, which has been lowered from a recent 62.58. The reading indicates that momentum has faltered and moved nearer to the neutral ground. A recovery above 50 will be closely monitored by traders as an indication of stability. A decline under 40 would be an indicator of over-selling and clearance of the path to more downward pressure.
The Moving Average Convergence Divergence (MACD) reinforces the bearish setup. The MACD-line at -0.678, which is significantly lower than the signal line at 1.863. The histogram indicates the expansion of red bars, which attests to selling momentum. Bears will probably have short-term control unless the indicator moves back to the 2.5 level.
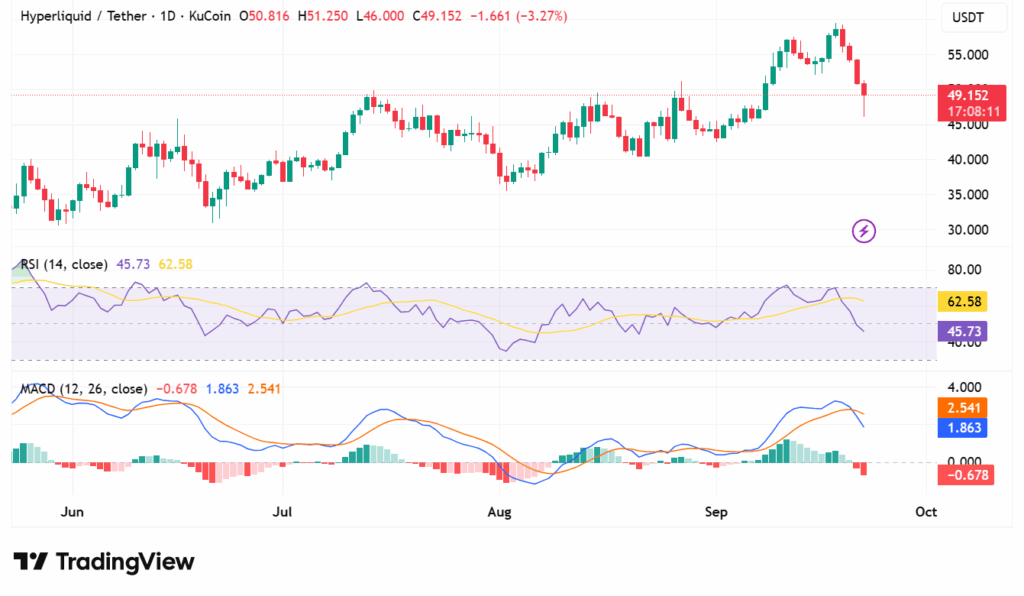
Source: TradingView
The short-term future of HYPE depends on the $49.5 mark. Bulls have to protect this area to create a recovery. The inability to retain would move attention to the support of $46 and $47. Technical indicators are trending downwards, and as the trading activity is increasing, volatility is high, and sentiment is still leaning towards caution.
Also Read: Cardano Eyes Major Breakout, Rally Could Hit $1.20


