
HYPE sits at a decisive technical junction as the HYPE/BTC pair tests the critical 0.526 level. According to the crypto analyst Umair Crypto, holding this zone could activate a confluence support pocket, enabling a relief bounce and forming a lower high targeting near $40.
Divergence setups are complete, leaving price action in a binary phase driven by momentum and structure.
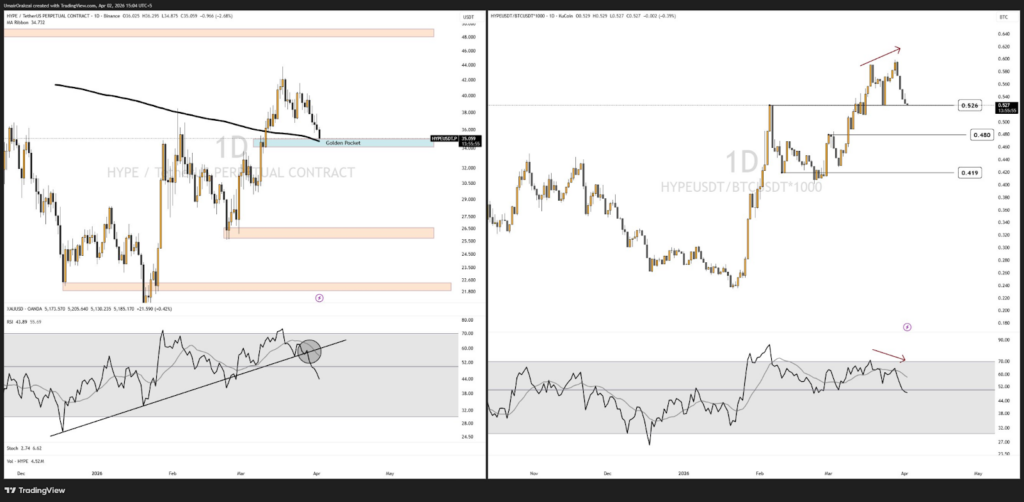
Source: Umair Crypto’s X Post
A breakdown below 0.526 would flip sentiment sharply bearish, breaking key confluence on the USDT pair, including the order block, 200 SMA, and golden pocket.
This would open a downside toward the $32 region. Rising $1.56B open interest and institutional flows via Ripple Prime add volatility, while a 9.92M token unlock on April 6 increases supply pressure.
Also Read: Hyperliquid Price Faces Make-or-Break Zone With $40 Upside or $32 Risk
According to TradingView, HYPE shows a pattern of recovery after touching bottom early in 2026. The price is currently $35.78, which is dangerously hanging above the intersection of the 20-EMA and 50-EMA.
While there seem to be some bullish trends for the short term, the appearance of the recent red candle confirms that there is some selling pressure.
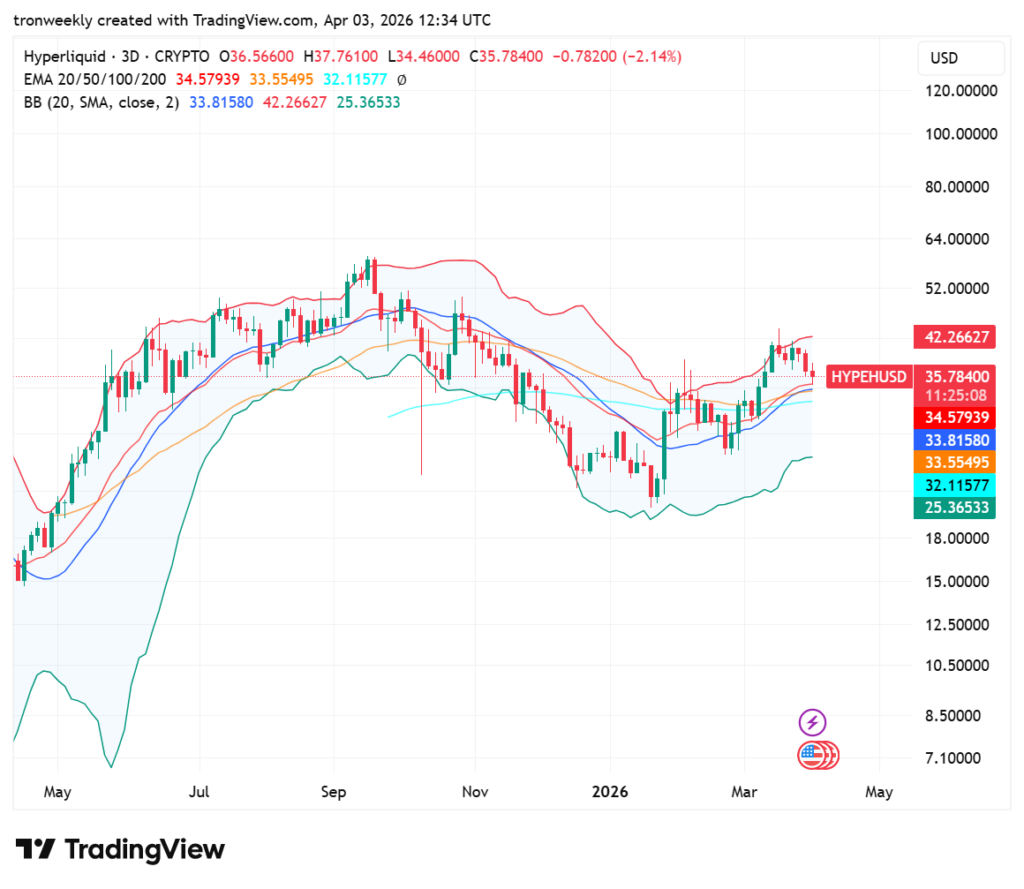
Source: TradingView
Volatile conditions are limited because the price continues to move within the range of the upper Bollinger Band of $42.26 and the support of the 200-EMA of $32.11.
A breakout of the resistance of $42.00 is needed to signal that a bullish trend reversal is taking place. Until then, range-bound movements can be expected from HYPE.
RSI stands at approximately 53.74 presently, which means that it has entered into neutral grounds.
Though the Relative Strength Index recently peaked at around the 70 mark, implying that the token was previously overbought or strongly bullish, its current decline toward the yellow moving average indicates that there might not be as much demand for the asset anymore.
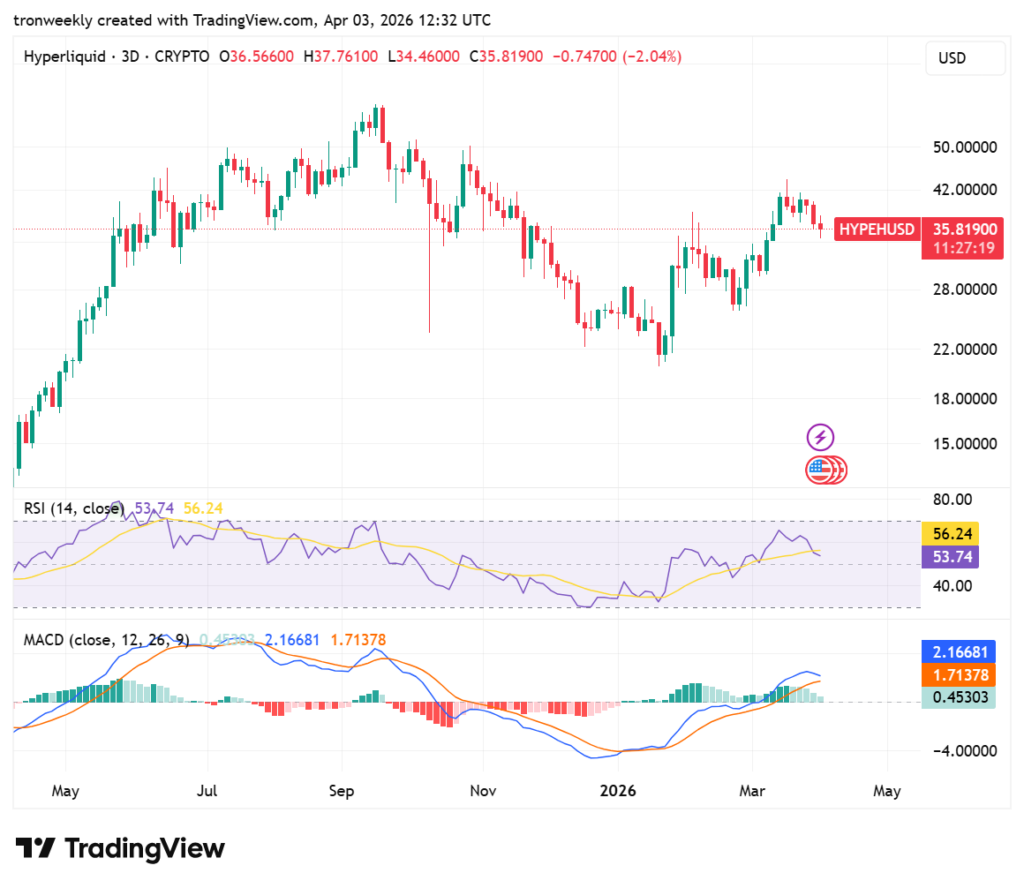
Source: TradingView
MACD reveals the recent uptrend is losing strength. While both the MACD and signal lines remain positive, the MACD is converging towards the signal line, and the histogram bars have become paler in color, indicating that the uptrend is losing momentum. There may be some sideways movement in the future, based on the trend lines’ curves.
This article contains market analysis and price predictions. These are not guarantees. Crypto markets are volatile. Always DYOR. Not financial advice.
Also Read: Hyperliquid Faces Downward Pressure as Price Nears Crucial Support Level

