HYPE traded close to $60 across major markets at the time of writing. It has pushed above the 0.382 Fibonacci retracement at $59.5, yet the daily chart still places three nearby obstacles above the current price.
The important distinction is simple: $59.5 now marks the level buyers need to hold, while the moving averages and channel ceiling determine whether the recovery can continue.
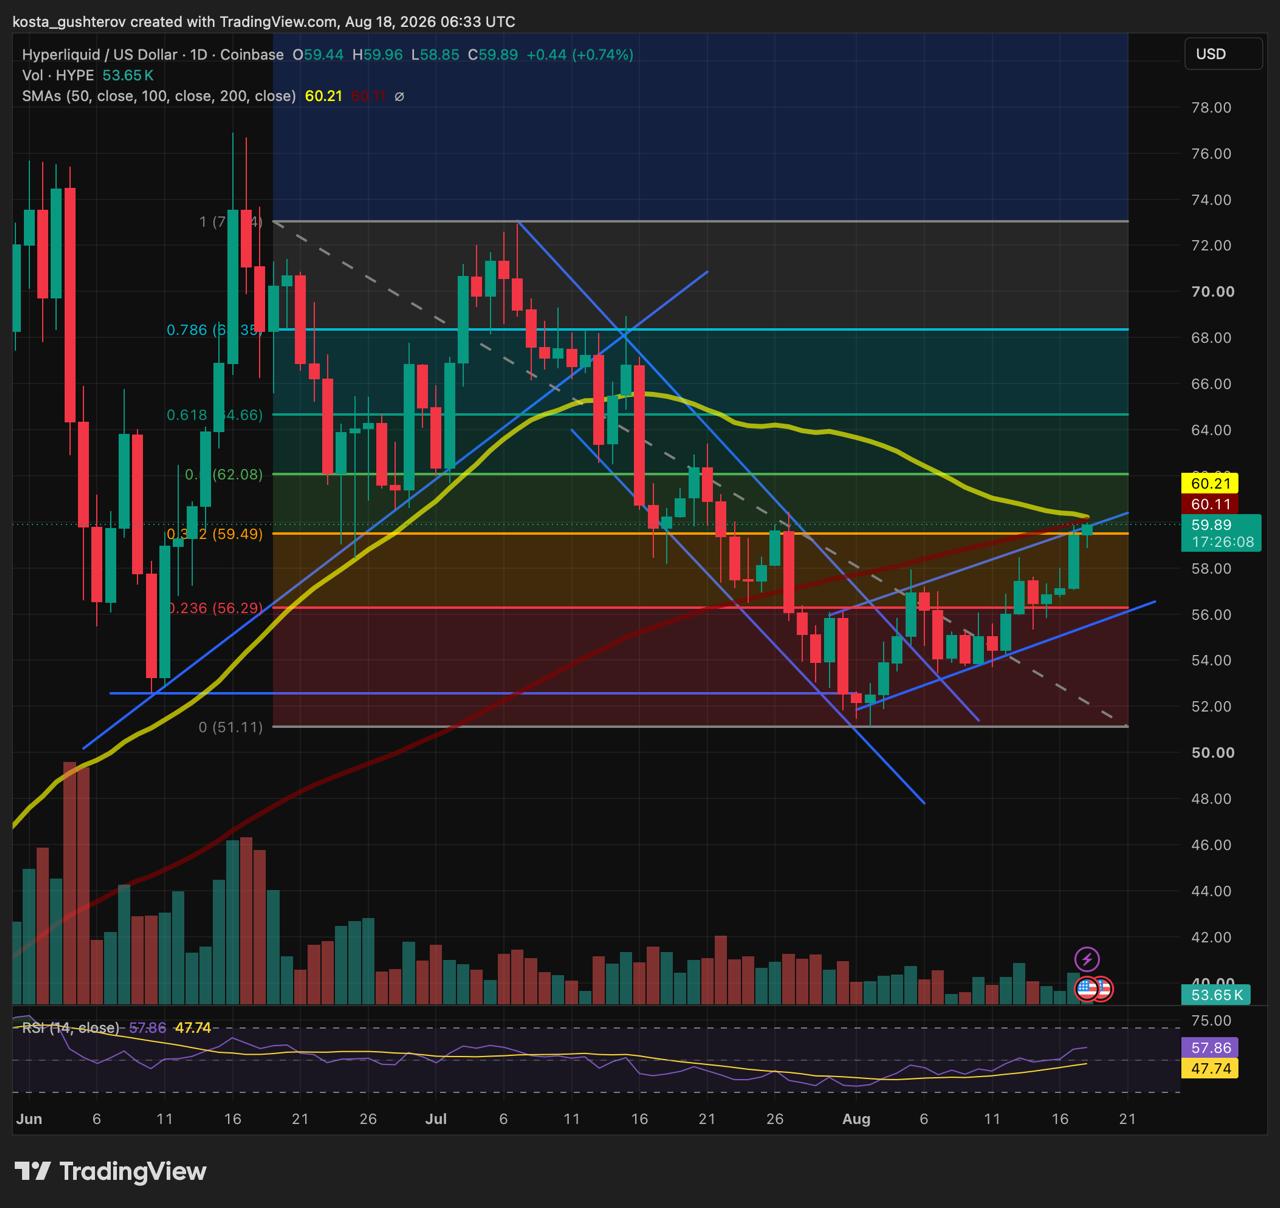
The chart measures the decline from the June high near $73 to the late-July low around $51. HYPE has already climbed through the first retracement level above the rebound. The next cluster is tighter.
| Level | Role on the daily chart |
|---|---|
| $59.5 | 0.382 Fibonacci retracement; current pivot following the latest move higher. |
| $60.1 | 100-day simple moving average. |
| $60.2 | 50-day simple moving average. |
| About $60.2–$60.4 | Upper boundary of the rising channel. |
| $62 | 0.5 Fibonacci retracement; the next visible level above the channel. |
| $56 | 0.236 Fibonacci retracement, close to the lower channel boundary. |
The channel line is an approximate chart boundary, unlike the fixed Fibonacci and moving-average values. Its importance comes from its overlap with the two moving averages.
A daily close above roughly $60.2–$60.4 would place HYPE over the entire cluster. Until then, the move remains a recovery into resistance rather than a confirmed continuation.
HYPE’s derivatives market remains large. CoinGlass listed about $2.53 billion in aggregate HYPE open interest at the time of writing, alongside roughly $1.59 billion in 24-hour futures volume and about $71.7 million in spot volume.
Binance offers one useful part of the picture. HYPEUSDT traded near $60.04, up about 1.3% over 24 hours. Its open interest was worth roughly $286.7 million, compared with about $291.1 million around one day earlier. That is a decline of about 1.5%.
The exchange therefore showed price appreciation without an expansion in open positions. The data leaves several explanations open, including short covering, long reduction and buying on other venues. It rules out a fresh build-up of Binance open interest as the immediate source of the move.
Hyperliquid’s own perpetual market showed about 22.73 million HYPE in open interest, worth roughly $1.36 billion at the live price. Its latest funding rate was positive at 0.00125% per hour, meaning long positions were paying short positions during that period.
A daily close above the channel ceiling would also clear the 50-day and 100-day averages. The next level on the chart sits at $62, the 0.5 Fibonacci retracement.
The move would still need to hold above the $60 area on later candles. A return under the moving averages would keep HYPE within the same range.
A loss of the 0.382 Fibonacci level would place HYPE back below the recovery pivot. The next chart area sits near $56.3, where the 0.236 retracement meets the lower edge of the channel.
That makes the near-term setup clear: $59.5 is the level buyers need to defend, while $60.1–$60.4 is the area they need to overcome. The daily close will show which side has control of the range.
Market data checked at 06:47 UTC on August 18, 2026. Technical levels come from the attached Coinbase HYPE/USD daily chart. Derivatives figures use live Binance, Hyperliquid and CoinGlass data.
The analysis is for informational purposes only and does not constitute investment advice. Cryptocurrency prices are volatile, and technical levels can change quickly.
The post HYPE Is Back at $60 – The Real Test Starts Here appeared first on Coindoo.