
ICON (ICX) is moving in a downward direction due to high volatility in the crypto market sector. The ICX price has depreciated by 4.44% over the last 24 hours, but it has slightly surged by 1.44% over the last week.
According to CoinMarketCap, ICX is trading at $0.03704, with a trading volume of $9.45 million, down by 85.82% over the last 24 hours. Furthermore, its market capitalization stands at $40.51 million, which has slightly declined by 4.22%.
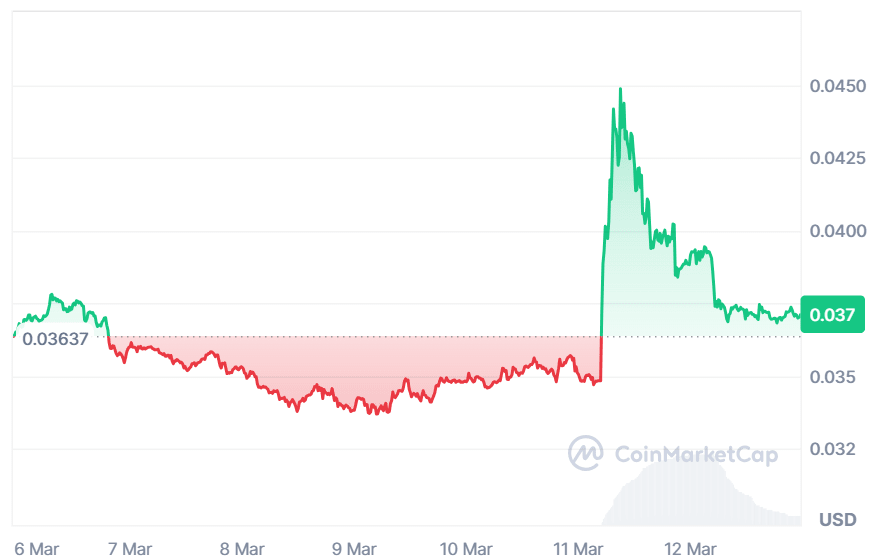
Source: CoinMarketCap
Also Read: Ethereum Whales Accumulate $152M in ETH as Network Hits All-Time High
ICON (ICX) has shown signs of renewed bullish momentum after breaking out of a multi-week falling wedge pattern, supported by a noticeable increase in trading volume.
According to the crypto analyst Alpha Crypto Signal, as of Thursday, March 12, the breakout suggests growing buying interest, but the price is now pulling back toward the former resistance line of the wedge, which is being watched as a potential support retest zone by traders.
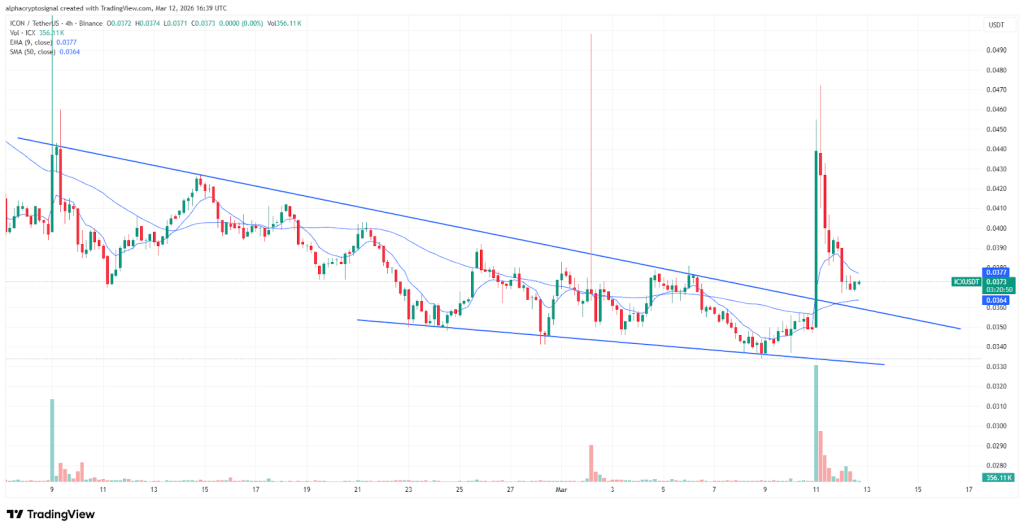
Source: Alpha Crypto Signal’s X Post
If ICX can hold its ground at this price and establish it as a support level, the setup of the breakout remains valid, which would increase the chances of continuing through to the next barrier at $0.044.
If the price falls through the support, though, it may reduce the likelihood of a continuation and cause it to fall back into the range of the previous wedge.
The relative strength index is currently at a neutral position of 47.05. The RSI has been moving away from the 40.60 signal line, indicating a slight recovery from the oversold position.
However, trading below the 50 level indicates that, although the bears are weakening, the bulls are still not able to create a trend reversal for ICX.

Source: TradingView
The MACD shows a bullish crossover as the blue line crosses above the orange line. Even though both lines remain below the zero line, the color changes to green as a sign that upward momentum is picking up.
This indicates that the old trend is losing steam, but a break above the zero line is necessary to signal a sustained shift in long-term trend direction.
This article contains market analysis and price predictions. These are not guarantees. Crypto markets are volatile. Always DYOR. Not financial advice.
Also Read: ICON (ICX) Surges Nearly 100% In Weekly Chart, Poised For Future Growth

