If momentum holds, the price could surge toward the $7.20 zone in the coming months.
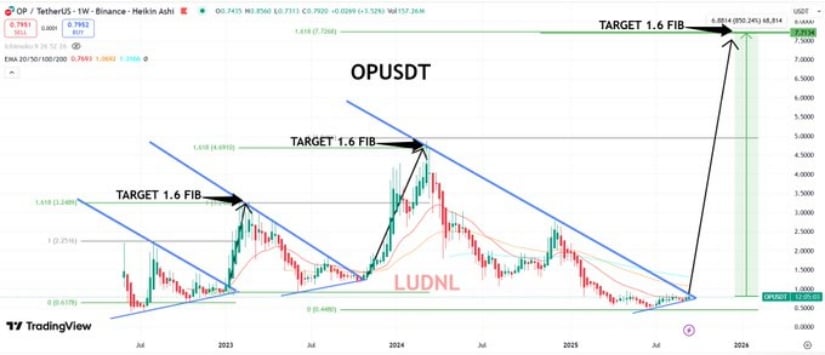
In a recent X tweet, analyst LUDNL highlighted how OP’s price structure has consistently respected Fibonacci extension targets in past cycles. Each breakout from a descending trendline has resulted in a rally toward the 1.6 Fibonacci level, with history showing strong symmetry in these moves. This pattern is now repeating, setting the stage for a potential breakout rally.

Source: X
Currently, the coin is trading around $0.72, consolidating at the bottom of its cycle. The chart indicates that the price has once again broken through a descending resistance line, similar to previous setups where rallies followed shortly after. If this fractal holds, the next upside target points toward the $7.20 zone, representing nearly a 10x move from current levels.
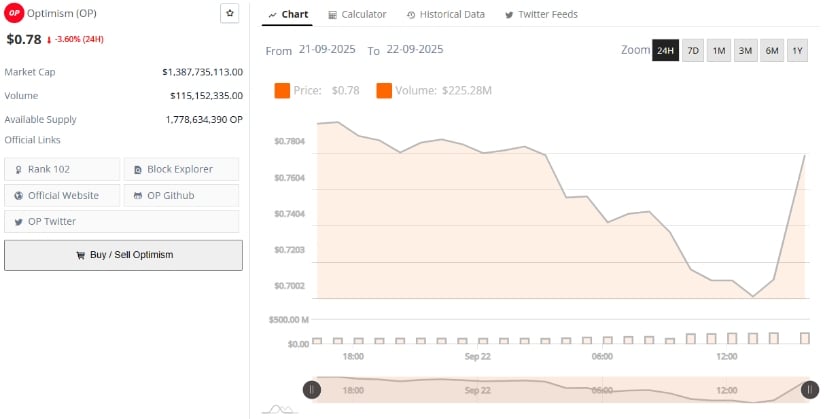
Supporting the analyst view, BraveNewCoin data added that Optimism is currently priced at $0.78, down -3.60% in the last 24 hours, with a market cap of $1.38 billion and daily trading volume of over $115 million.
Despite the short-term pullback, the token remains among the top 102-ranked assets, with a circulating supply of 1.77 billion tokens actively traded across major exchanges. This reflects a healthy and liquid market environment, which is often a prerequisite for strong price recoveries.

Source: BraveNewCoin
The broader sentiment around the asset is also supported by its consistent ecosystem growth and ongoing integrations in the Ethereum scaling sector.
While the current dip reflects market volatility, the data suggest that the coin is far from weakening fundamentally. Instead, this consolidation could be laying the groundwork for a major breakout, aligning with LUDNL’s Fibonacci-based projection toward the $7.20 target in the longer term.
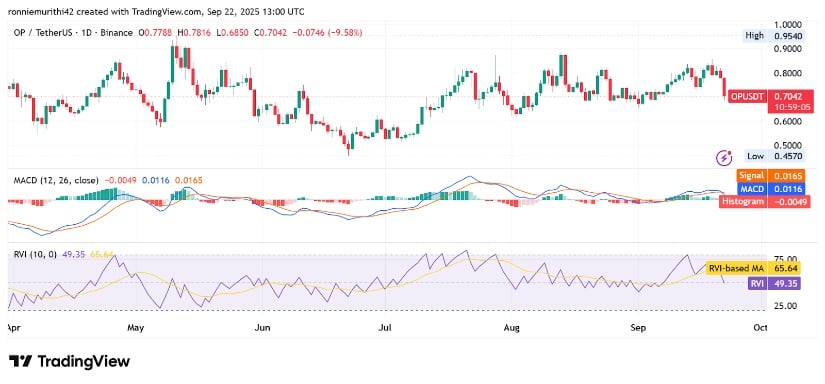
At the time of writing, the coin was trading at $0.7066, marking a sharp 9.27% daily decline. The candlestick pattern shows strong selling pressure after OP failed to hold above the $0.78 level, pushing it closer to its recent support zone. The market has been volatile, with price action ranging between $0.68 and $0.95 in recent weeks, reflecting uncertainty among traders.

Source: TradingView
Technical indicators reinforce this bearish short-term outlook. The MACD histogram has flipped negative at -0.0047, showing weakening momentum, while the MACD line (0.0118) has slipped just below the signal line (0.0166), hinting at a bearish crossover.
Similarly, the Relative Vigor Index (RVI) at 49.48 is trending below its moving average of 65.64, confirming waning bullish strength. Unless the crypto finds strong buying support near $0.68, further downside risk toward the $0.60–$0.62 zone remains possible before a potential rebound.
Also read: Retail Investors Drive Biggest Weekly Stock Inflows Signaling Possible Market Top