If you are new to trading and wondering how traders analyze charts, mark up price action, or use indicators for signals—TradingView is where most of it happens.
Whether you trade crypto, stocks, forex, or indices, TradingView is one of the most powerful and user-friendly charting platforms available.
This guide walks you through TradingView in a detailed, structured, and beginner-friendly way.
By the end, you’ll not only be able to navigate the platform with confidence but also use it to make informed trading decisions.
Let’s get started!
Prefer a video guide? Watch Jude Umeano walk you through how to use TradingView in this YouTube video.
Jude Umeano, one of Nigeria’s most respected and successful traders just launched Afibie, a mentorship platform built to help you earn your first $10,000 and beyond from the markets.
Whether you’re new or stuck at break-even, this is your next step.👉 Visit Afibie now.
TradingView is a web-based platform designed for real-time financial charting, technical analysis, and trading across multiple asset classes.
Launched in 2011, it has grown into a global community with millions of users ranging from retail traders and investors to professional analysts and institutions.
With TradingView, users can:
TradingView supports markets like:
It offers both free and premium plans with various levels of features and charting capabilities.
Go to TradingView and create an account. You can register using your email, Google account, Apple ID, or other social logins.
TradingView offers Premium plans. However, its free plan is more than enough for beginners; it includes access t most of the essential features.
Once you’re in:
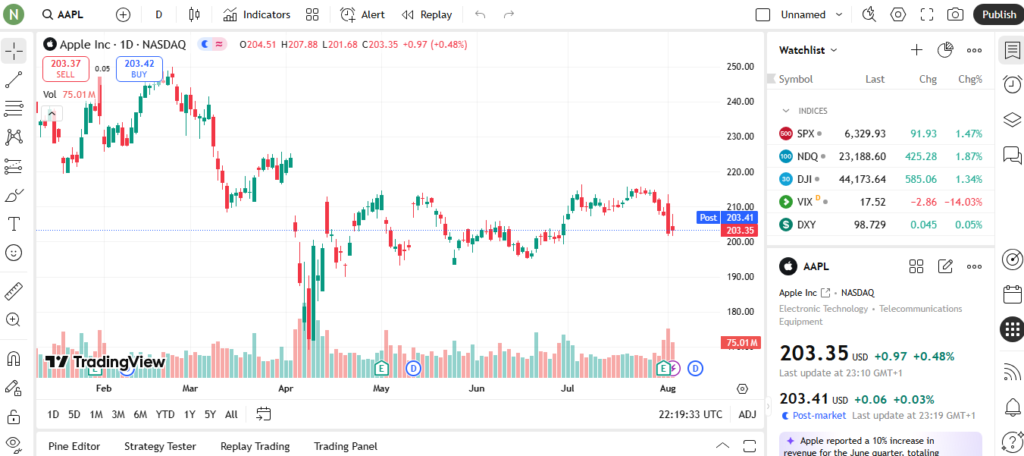
When your chart loads, you’ll see multiple panels and tools. Here’s a quick breakdown of the interface:
Familiarize yourself with these areas. For example, here’s what you can do:
This will help you navigate faster as you progress.
Click the Settings icon at the right of the chart or right-click on the chart and choose “Settings”.
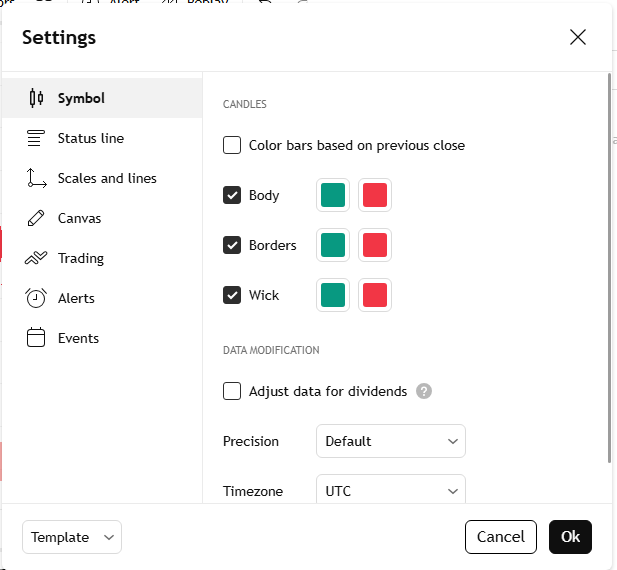
There are seven sections: Symbol, Status Line, Scales and Lines, Canvas, Trading, Events, and Alerts. From these options, you can:
Not sure how to customize your chart? Skip to 6:12 in the video to see how Jude Umeano does it.
Customizing your workspace improves clarity and focus when analyzing charts.
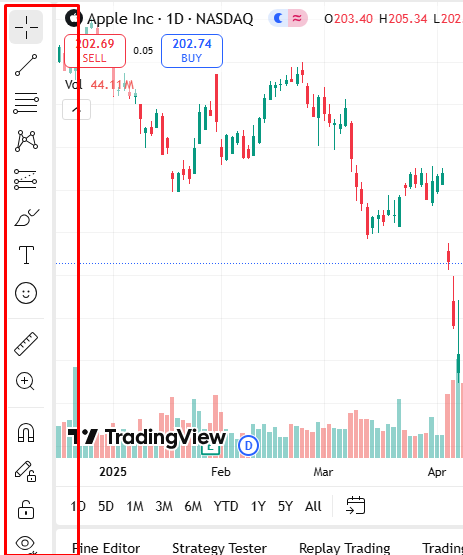
TradingView’s left sidebar is where most of your chart drawing and annotation tools live.
This is essential for analyzing price action visually, marking up support/resistance zones, identifying patterns, and tracking your trades.
Here’s a breakdown of some of the most important tool icons and how to use them:
(a) Cursor
The Cursor tool allows you to change how your mouse pointer appears on the chart.
Clicking this tool opens a menu with the following options: Cross (default), Dot, Arrow, Demonstration, and Magic.
Use the Eraser to delete drawn objects directly by clicking on them. You’ll also see a toggle: “Values tooltip on long press”.
When enabled, pressing and holding on any point of the chart displays OHLC data (Open, High, Low, Close) at that exact point.
(b) Trend Line Tools
This is where you draw straight lines to connect price points on the chart.
By default, it’s set to Trend Line, which helps you identify trends by connecting swing highs or lows. You can customize the line’s color, thickness, and add text.
Click the small arrow or right-click to access other line tools like Ray, Info Line, Extended Line, Trend Angle, and Cross Line, depending on the line type you need in your analysis.
(c) Fibonacci & Gann Tools
This section gives you access to powerful tools for measuring price movements and projecting future levels.
By default, it opens with Fibonacci Retracement, but clicking the small arrow reveals more tools like Trend-Based Fib Extension, Fib Channel, and Gann Box.
These are often used to spot potential support/resistance zones, trend targets, and time-based setups for advanced technical analysis.
(d) Geometric Shapes
This section (it starts as Brush by default) lets you draw on your chart in different ways:
You can right-click or click the small arrow to see all the tools and pick the one you like best for your analysis.
(e) Ruler Tool
The Ruler tool shows how much the price moved between any two points on the chart, whether from bottom to top or top to bottom.
It tells you the percentage change, dollar difference, and how many candles it took.
This helps you check profit potential, measure pullbacks, and compare how strong different moves are. To use it, left-click and drag from the point you want to measure.
(f) Zoom
This tool lets you zoom in on any part of the chart. When you click the icon, your cursor changes.
Just click on the starting point of the area you want to zoom into, then drag your mouse slightly to draw a box around it.
Once you click at the end point, the chart will automatically zoom into that selected area. Alternatively, you can also zoom in and out using your mouse scroll wheel or trackpad.
(g) Magnets
The Magnet tool makes your drawing snap directly to key candle points like the open, close, high, or low.
This helps you draw more accurately without missing the exact level. You can switch between Weak and Strong mode depending on how tightly you want it to snap.
(h) Drawing Mode
The “Keep Drawing Mode” option lets you keep using the same tool again and again without needing to reselect it.
The “Lock All Drawings” feature prevents you from moving or deleting your drawings by mistake. Both tools make drawing easier, especially when you’re doing a lot of chart work.
(i) Hide/Show Drawings
This button lets you hide or show all your chart drawings with one click. It’s useful when your chart is full of lines and shapes, and you want a clean view of the price without deleting anything.
Technical indicators are tools that use math and price data (like open, high, low, close, volume) to help traders understand market trends, momentum, and potential entry or exit points.
They appear directly on your chart or in a panel below, helping you make smarter trading decisions.
Interestingly, TradingView supports hundreds of built-in indicators. To add indicators:
Popular beginner-friendly indicators include:
You can customize each indicator’s settings, colours, and visibility. You can also star your favorite indicators so they appear in your quick-access list, and save indicatorand save indicators as templates to apply them instantly across different charts.
Don’t overload your chart. Stick to 2 or 3 indicators while learning, so your analysis stays clear and effective. Speaking of which, if you’re using a free account, you won’t be able to add more than two indicators to a chart.
Alerts help you stay updated without watching charts 24/7.
How to set one:
You’ll be notified via app, email, or pop-up when the alert is triggered.
After setting up your chart with indicators and drawings:
Now every time you come back, your work will be right there, no need to set it up again.
Replay lets you simulate past price movement in real-time. To use it:
This is perfect for backtesting strategies or practicing chart reading without risking real money.
However, the Replay is only available to Premium users, so you’ll need a paid plan to access this feature.
This step is helpful if you want to trade directly on TradingView:
This lets you open/close positions straight from the chart without leaving TradingView.
And that’s pretty much how to use TradingView like a pro! The free version gives you almost everything you need to do solid technical analysis, but going Pro unlocks more tools and settings if you ever need them.
The comparison at a glance!
| Features | Free | Pro |
| Indicators per chart | 2 | 5–25 |
| Replay | No | Yes |
| Alerts | 1 | 10–400 |
| Multiple charts per tab | No | Yes |
| Extended trading hours | No | Yes |
| Ad-free | No | Yes |
The free plan is great for beginners, but the Pro version unlocks advanced charting features, especially the Replay function, which lets you backtest strategies by simulating past market conditions.
This is crucial for understanding how your strategy would have performed historically.
Let’s conclude!
TradingView is more than just a charting tool, it’s a complete trading ecosystem that evolves with your skill level.
From simple price tracking to complex backtesting and automation, it covers every angle a trader needs.
If you’re just getting started, take it slow. Learn the basics, practice regularly, and make the platform part of your daily trading workflow.
Enjoyed the post but still have questions? Drop them in the comments below — we’ll be happy to help.
And if you found this guide useful, feel free to share it using the social media icons below.
The post How to Use TradingView: A Complete Step-by-Step Guide for Beginners appeared first on NIGERIA BITCOIN COMMUNITY.


