
In January, Microsoft shares came under pressure following the company’s earnings report. Although both revenue and earnings per share exceeded analysts’ expectations, growth in the Azure cloud platform slowed to 39% year-on-year from 40% in the previous quarter—enough to disappoint investors. The market is now preparing for the next release: on 29 April, after the close of trading, Microsoft will publish results for the third quarter of its 2026 financial year. Analysts forecast adjusted EPS at $4.04, up 17% from the same period last year. The focus remains on Azure’s performance and the expansion of the paid user base for Copilot within Microsoft 365.
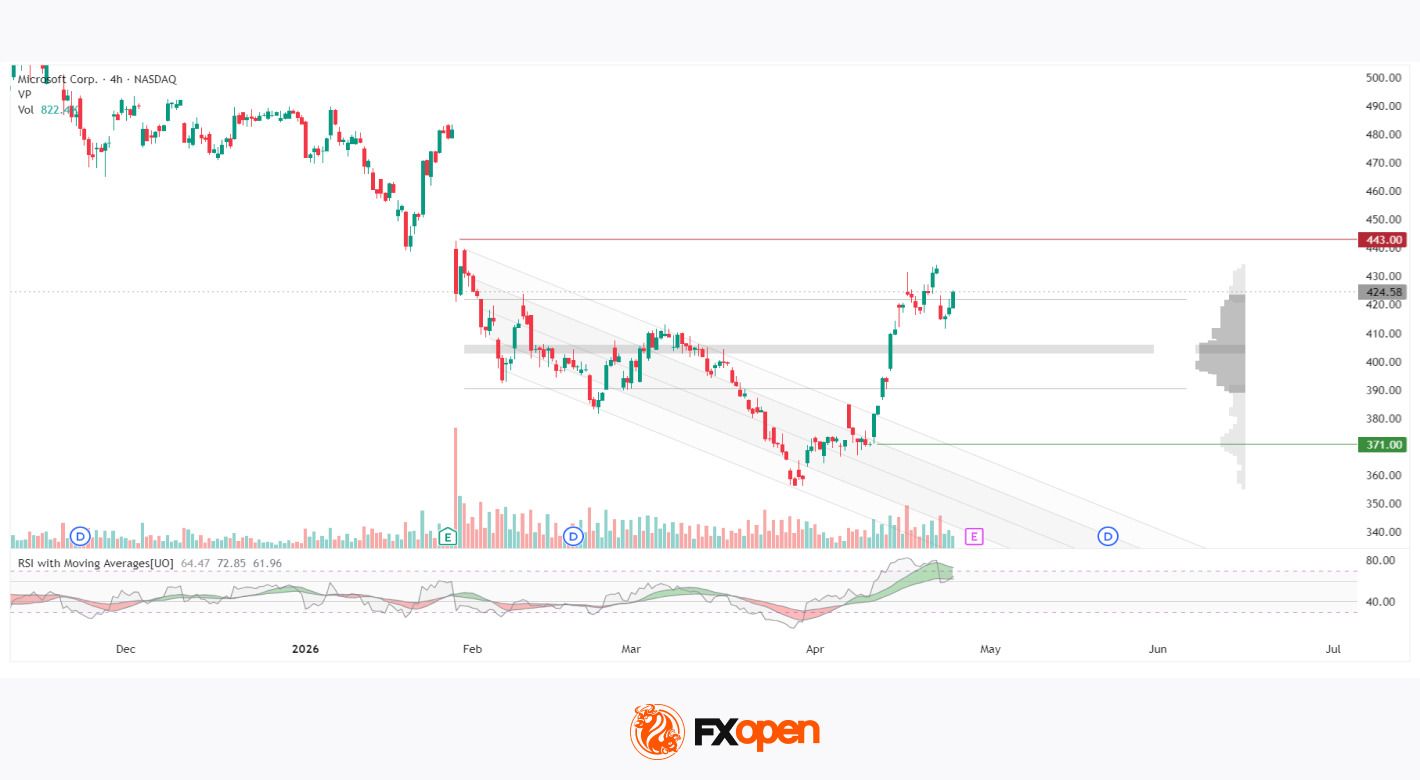
Until late January, Microsoft shares moved sideways, but the 29 January earnings release triggered a sharp gap down accompanied by an abnormal surge in vertical volume, prompting a rapid repricing of the asset. This move laid the foundation for a well-defined downward channel, with the price steadily declining along its boundaries to a low near 357 by the end of March. In April, a recovery pushed the price to around 433, followed by consolidation within the 412–433 range, where it remains ahead of the upcoming earnings announcement.
The horizontal volume balance zone is located at 403–406, with the broader market profile spanning 390–422—current prices are trading above the bulk of accumulated volume. The nearest significant resistance stands at 443, while support levels are seen at 390 and 371. The RSI with moving averages shows readings of 64 / 72 / 61: the oscillator sits between two upward-sloping moving averages, reflecting a bullish bias within the consolidation phase.
The 412–433 consolidation range is forming just ahead of the 29 April earnings release—an event similar to the one in January that triggered a two-month decline. The volume profile indicates that prices remain above the balance zone at 403–406, while RSI holds in positive territory. The market’s reaction to the upcoming results will determine whether the recovery extends further or the price returns to the prior accumulation range.

