
Internet Computer (ICP) is moving in a bearish-to-bullish setup as BTC has crossed the $73K mark after a prolonged downtrend in the crypto market. The ICP price has surged by 1.72% over the last 24 hours and 8.81% over the last week.
According to CoinMarketCap, ICP is trading at $2.69, with a trading volume of $92.11 million, up by 23.59% over the last 24 hours. Furthermore, its market capitalization stands at $1.48 billion, which has slightly surged by 1.74%.
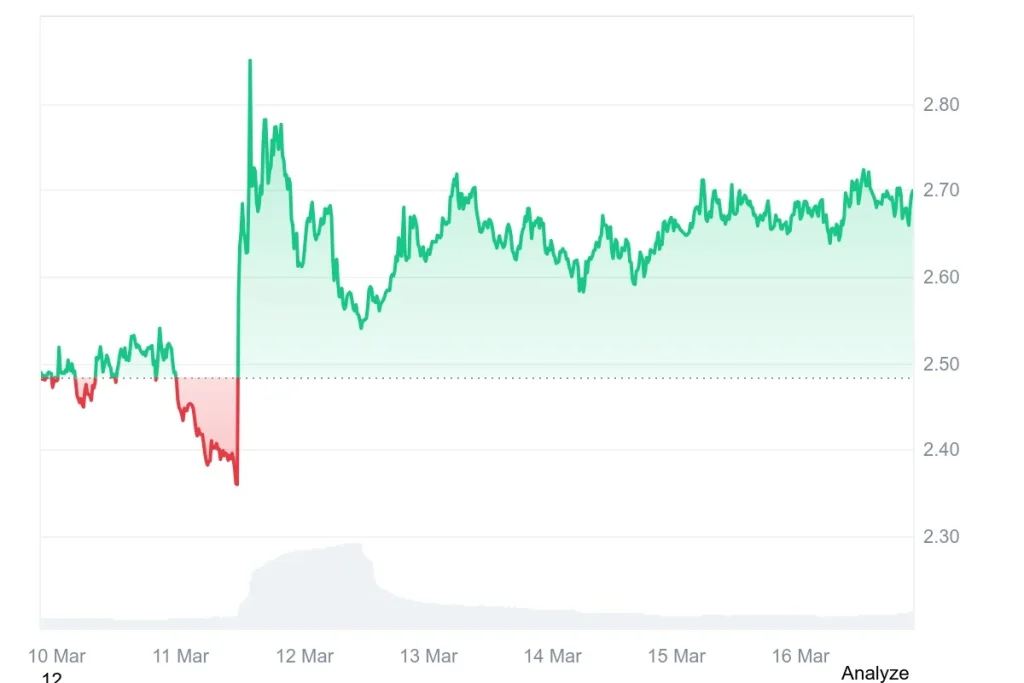
Source: CoinMarketCap
Also Read: Internet Computer (ICP) Descending Channel Bounce Could Spark $17.50 Rally
Internet Computer (ICP) has broken out of a persistent falling wedge pattern, signaling an end to its recent downtrend. According to the crypto analyst CW, traders are optimistic as the token shows renewed bullish momentum.
The breakout suggests that the token could test its first resistance target at $4.80, marking a potential turning point in market sentiment and investor confidence.
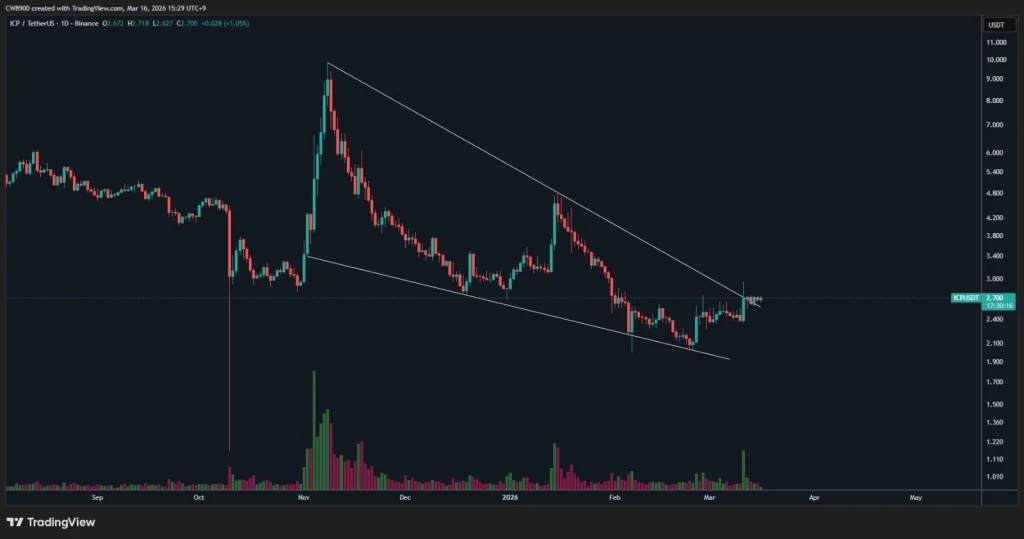
Source: CW’s X Post
If the momentum holds its ground, ICP could have its eyes on a secondary target of $9, which would be a huge positive. CW has pointed out that the falling wedge pattern is a precursor to a trend reversal, and this breakout could attract more buyers.
The price movement will be closely watched, as holding on to this position could be the next big chapter for the Internet Computer ecosystem.
According to TradingView, ICP is about to enter a quieter phase after the initial fluctuations. The current price is approaching the top Bollinger Band at $2.74, remaining above the 20-day simple moving average at $2.51.
This is a sign that the current trend is transitioning from a bearish trend to a neutral or bullish phase, with the lower boundary at $2.10 still acting as strong support.

Source: TradingView
The MACD indicator further supports this change, showing a bullish crossover with the signal lines moving upwards towards the zero level. The presence of positive histogram bars shows increasing buying pressure.
Although the price is yet to cross the initial yearly highs, the alignment of the 20-day average and the improving indicator suggests a breakout if the current levels of resistance are overcome.
This article contains market analysis and price predictions. These are not guarantees. Crypto markets are volatile. Always DYOR. Not financial advice.
Also Read: Internet Computer (ICP) Signals Upside Move With $3.21 Target in Sight

