
IOTA is now officially listed on the @Bullish digital asset exchange, and as of March 3, 2026, this milestone opens new opportunities for global traders and investors.
This enhances IOTA’s visibility and accessibility, allowing the community to engage more actively with the growing digital asset ecosystem.
The listing also strengthens IOTA’s trajectory toward long-term institutional adoption. By providing increased liquidity and credibility, this move supports broader market participation and positions IOTA as a more attractive option for investors seeking exposure to innovative blockchain solutions worldwide.
Also Read: IOTA Price Analysis: Descending Triangle Could Lead to $0.350 Rally
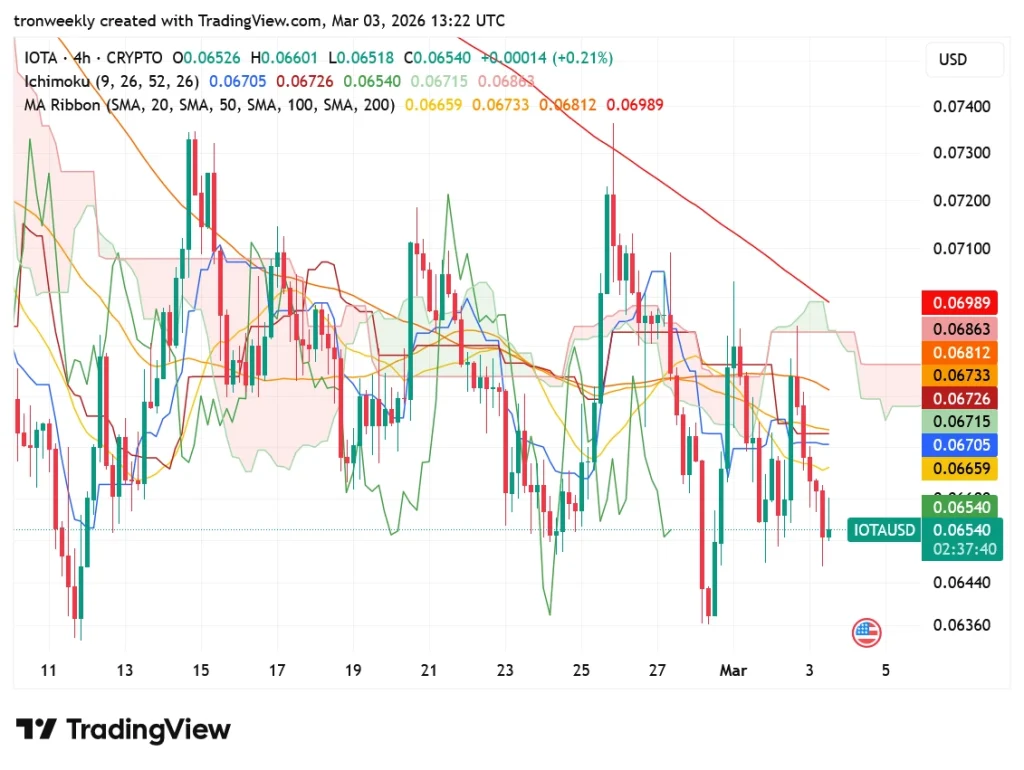
The token is trading around $0.0653, below the 20/50/100/200 SMAs, with the 200 SMA near $0.0699 acting as dynamic resistance, as per the TradingView chart.
The ribbon is bearishly aligned, and the price remains under the cloud. Immediate downside target sits at $0.0640, with an extended target near $0.0630 if selling pressure accelerates.
Ichimoku depicts a picture of prices languishing below the Kijun and Tenkan lines, meandering through a dissipating cloud, and suggesting weak momentum.
The trailing line appears to be stuck below the previous candles. A corrective move will face resistance around $0.0672-$0.0686. The first target is set at $0.0675, followed by a target at $0.0690.
The recent candles form a staircase pattern of lower highs and lower lows, indicating the continuation of the short-term downtrend. The volume spikes on the red candles indicate distribution.
The level of support at $0.0645 is weak; a breakthrough will provide a clear path to the target of $0.0635. To turn bullish, a return above $0.0670 is required, aiming at the target of $0.0700.
Under the indicator’s observation, the RSI (14) is at 42.57, falling below the middle mark of 50, which is slightly bearish. It barely managed to move away from the area around 30, but it could not retain strength above 50.
The RSI average is at 46.37, slightly above the price momentum, indicating waning support and a cautious short-term atmosphere.

The MACD (12, 26, 9) indicates a bearish bias, as the MACD line is at -0.00046, which is below the signal line of -0.00036.
The histogram is also at -0.00011, showing weakening bullish market momentum. Although the pressure is not strong, the negative cross shows that the bearish forces are still in control.
Listing on Bullish raises the liquidity of IOTA to $0.0653, attracting institutional investors in pursuit of reliable digital assets worldwide.
The MACD negative crossover at -0.00046 indicates that price drivers are pushing the price down, suggesting to investors the possible opportunity for a rebound to $0.0675-$0.0690.
Also Read: IOTA’s RealFi Ecosystem Aligns With a16z’s Vision for the Next Blockchain Era

