
KAVA price analysis shows a rebound after testing descending channel support near $0.0598 on April 24, 2026. The move signals early recovery as buying interest returns, according to analyst Jonathan Carter.
CoinMarketCap data shows the KAVA crypto price trading near $0.0604, holding a critical support zone. This stabilization suggests the asset may be shifting away from prolonged downside pressure.

Currently, KAVA is reacting positively to the testing of a very important area (the lower end) of a long-term downtrending channel on the weekly chart. Presently, this area will continue to act as a good buying opportunity for those who wish to acquire KAVA.
Carter stated that he had seen similar formations before, and they were followed by large bull movements. Although the descending channel remains in place, with resistance continuing to cap further price advances.
Each successive test of the support area demonstrates growing interest among buyers.

Also Read | GMT Price Prediction Signals Downside as Bearish Setup Targets $0.00930
Current KAVA price analysis indicates improvement in short-term technical indicators (such as momentum) relative to the larger price downtrend. Currently, the 20-period Exponential Moving Average (EMA) remains below the 50-period EMA, according to TradingView.
This represents the bearish condition exhibited by both indicators, although there are some early indications of flatness. The Relative Strength Index (RSI) is near 30, which signifies that the cryptocurrency is oversold and potentially poised for a bounce.
The MACD indicator is exhibiting initial convergence, which suggests that there will be a positive change in momentum. Both futures and spot volumes have been relatively stable. Therefore, the accumulation process appears to be orderly rather than speculative.

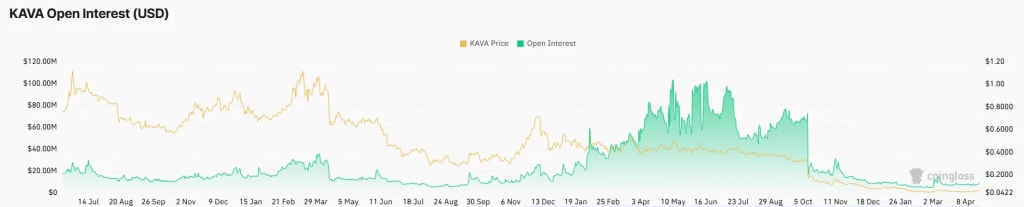
CoinGlass reports that open interest has risen by 3.26% to more than $9 million. This implies that more participants are entering the market due to the KAVA crypto price being near support.
In contrast, futures volume fell by 3.75%, indicating that market participants are exercising caution.
The funding rate is neutral, indicating a balance between long and short positions among traders. Funding spreads across exchanges represent divergent sentiment and localized trading strategies.
On shorter time frames, the KAVA price action can be viewed through a defined Fibonacci retracement structure. Resistance exists at $0.061 (which corresponds with the 0.236 retracement level).
Support resides at $0.055, representing a critical structural support level for price stability. If resistance is broken, it would likely represent a short-term bullish continuation.
Failure to maintain support could negate the current KAVA price analysis perspective.
Based on historical breakout patterns and past price movements, Carter identified several key target prices for KAVA. They are $0.07, $0.13, $0.29, $0.50, $0.75, and $1.25.
The KAVA price analysis provides evidence of a substantial upside potential if momentum continues to build. Confirmation will require sustained buying volume along with a successful structural breakout.
KAVA remains inside a macro downtrend with all long-term EMA’s trending down. Therefore, any attempt to break these levels will be limited until such time as there is a confirmed structural breakout.
Market conditions, along with liquidity conditions, continue to drive altcoin recovery trends. Cautious optimism represented by derivatives data increases the risk of volatility when support or resistance is reached.
This article contains market analysis and price predictions. These are not guarantees. Crypto markets are volatile. Always DYOR. Not financial advice.
Also Read | Bitcoin Cash (BCH) Eyes $486 Breakout, Targets $660 Next

