The move was alongside the whole market down with it: total crypto market cap sits at $2.08 trillion after shedding $55.2 billion since midnight UTC, on $433.3 billion in volume.
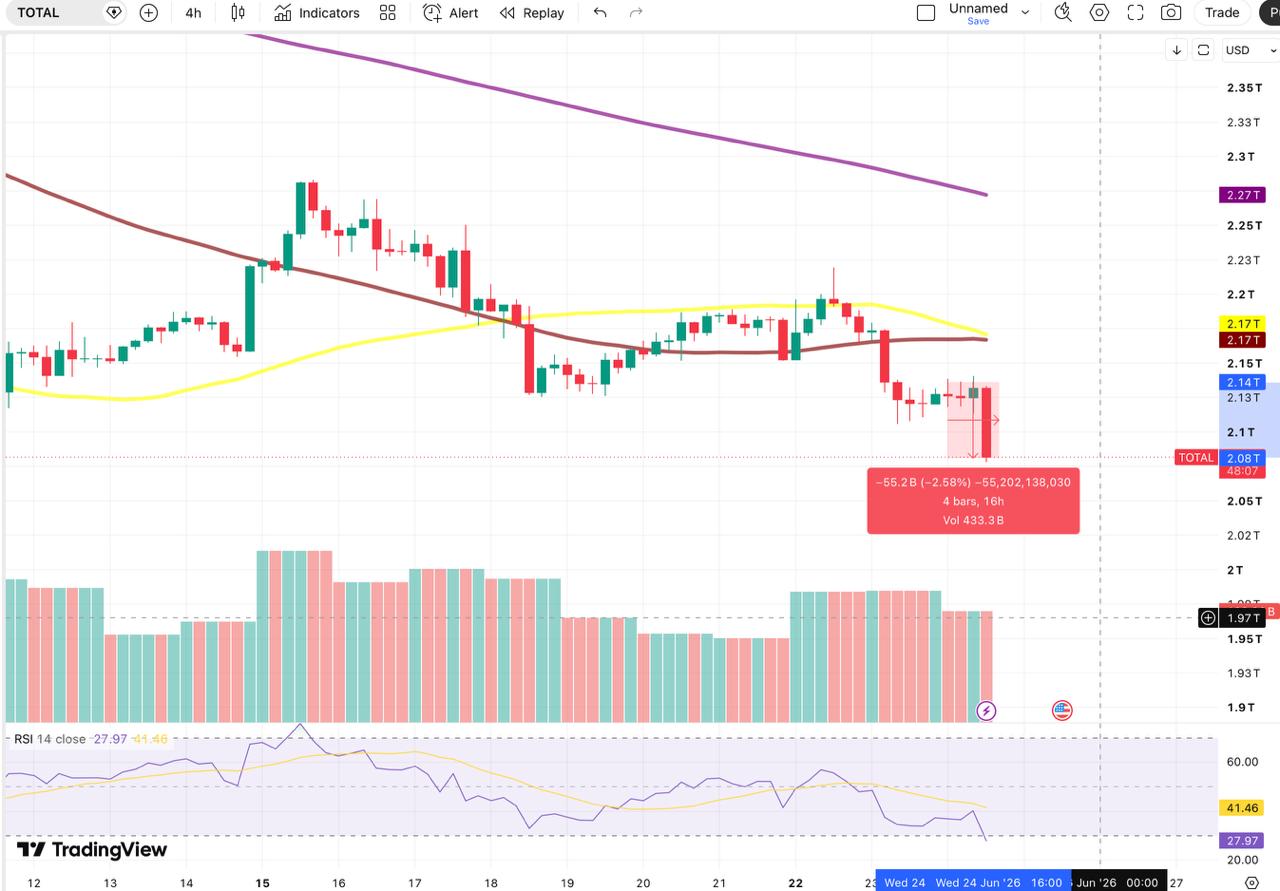
The total market cap chart shows why this looks like acceleration rather than a fresh shock. The market has broken below both its 50-day and 100-day moving averages, which have converged near $2.17 trillion and now sit overhead as resistance rather than support. The 200-day average is descending from around $2.35 trillion and hasn’t been retested since June’s recovery attempt. On the 4-hour chart, RSI has dropped to 27.41 at the time of writing according to data from TradingView, deep in oversold territory, with the signal line far above at 41.42, a sign momentum has collapsed sharply without any reversal forming yet. Today’s candle is the largest red bar on the visible chart, extending the existing downtrend rather than starting a new one.
The damage was broad, but uneven. XRP took the hardest hit among the majors, down 2.37% on the day and 10.28% on the week to $1.07 according to CoinMarketCap data at the time of writing, slipping back below the $1.10 support that had been holding. Hyperliquid’s HYPE was the biggest weekly loser in the top 10 at -15.88%, down 3.13% on the day to $60.58. Dogecoin fell 2.86% on the day and 11.14% on the week to $0.07646. Ethereum dropped 1.04% to $1,639, extending its weekly loss to 6.36%.
Others fared better. BNB held relatively firm at -0.91% on the day and -5.68% on the week at $567, while Solana slipped just 0.46% to $68.47, down 5.39% weekly. TRON was the only non-stablecoin in the top 10 with a weekly gain, up 2.53%.
The clearest pattern is that weekly losses are much larger than 24-hour moves across the board, which means today is the tail end of a sustained slide rather than a single-session event. XRP’s 10.28% and HYPE’s 15.88% weekly drops show altcoin pressure had been building for days before Bitcoin broke $61K.
The CMC20, a CoinMarketCap index tracking the 20 largest cryptocurrencies as a single benchmark for the broader market, is down 6.58% on the week, slightly worse than Bitcoin’s 6.24%. Because it spreads across the top 20 rather than one coin, that steeper drop points to broad-based weakness rather than anything Bitcoin-specific.
The crypto selloff is unfolding alongside a sharp drop in crude. WTI fell 4.60% to $69.81 and Brent dropped 4.71% to $73.45 according to OilPrice data. Oil is declining for a clear reason: easing geopolitical risk after the US-Iran deal signed last week, which stripped out the war premium that had been priced into energy.
That makes the divergence interesting. Oil and crypto usually move opposite each other on geopolitical news, oil falling on peace signals is textbook. Crypto falling at the same time suggests its selloff is running on different fuel: macro tightening, ETF outflows, and institutional rotation rather than any geopolitical trigger.
The Iran dynamic deserves a caveat, though. This isn’t the first time the two sides have reached an agreement and markets priced in calm. Previous rounds of talks produced ceasefires and deals that later broke, with both sides returning to hostilities. Last week’s deal reduced the immediate risk premium, but the underlying tension isn’t resolved, and markets with any memory of that history know it. The fact that crypto isn’t catching the same relief bid lifting oil suggests the risk-off mood in digital assets is its own story, independent of the de-escalation.
A few markers will signal which way this might resolve from here:
The post Bitcoin Sinks Under $61,000 as Crypto Falls Alongside Oil appeared first on Coindoo.