Key Takeaways:
Two pieces of news landed on June 1st and neither was positive. The more significant was geopolitical. Iran’s negotiating team announced it was suspending all indirect talks and message exchanges with the United States through mediators. According to CNBC, the decision came in protest against escalating Israeli military operations in Lebanon, which Tehran views as a violation of the fragile regional ceasefire holding since April. With peace talks frozen, the geopolitical risk that has been pressing crypto markets all week got heavier rather than lighter.
The second development was Strategy’s SEC filing disclosing it had sold 32 BTC between May 26th and May 31st. The reason stated in the document was to fund preferred stock dividend distributions, a routine financial obligation rather than a conviction shift. Markets appear to have reacted to the headline rather than the detail, with any Bitcoin sale from the world’s most prominent corporate accumulator generating noise disproportionate to its actual size. At 32 coins against a total holding of 843,706 BTC, the disposal was barely a rounding error on their balance sheet.
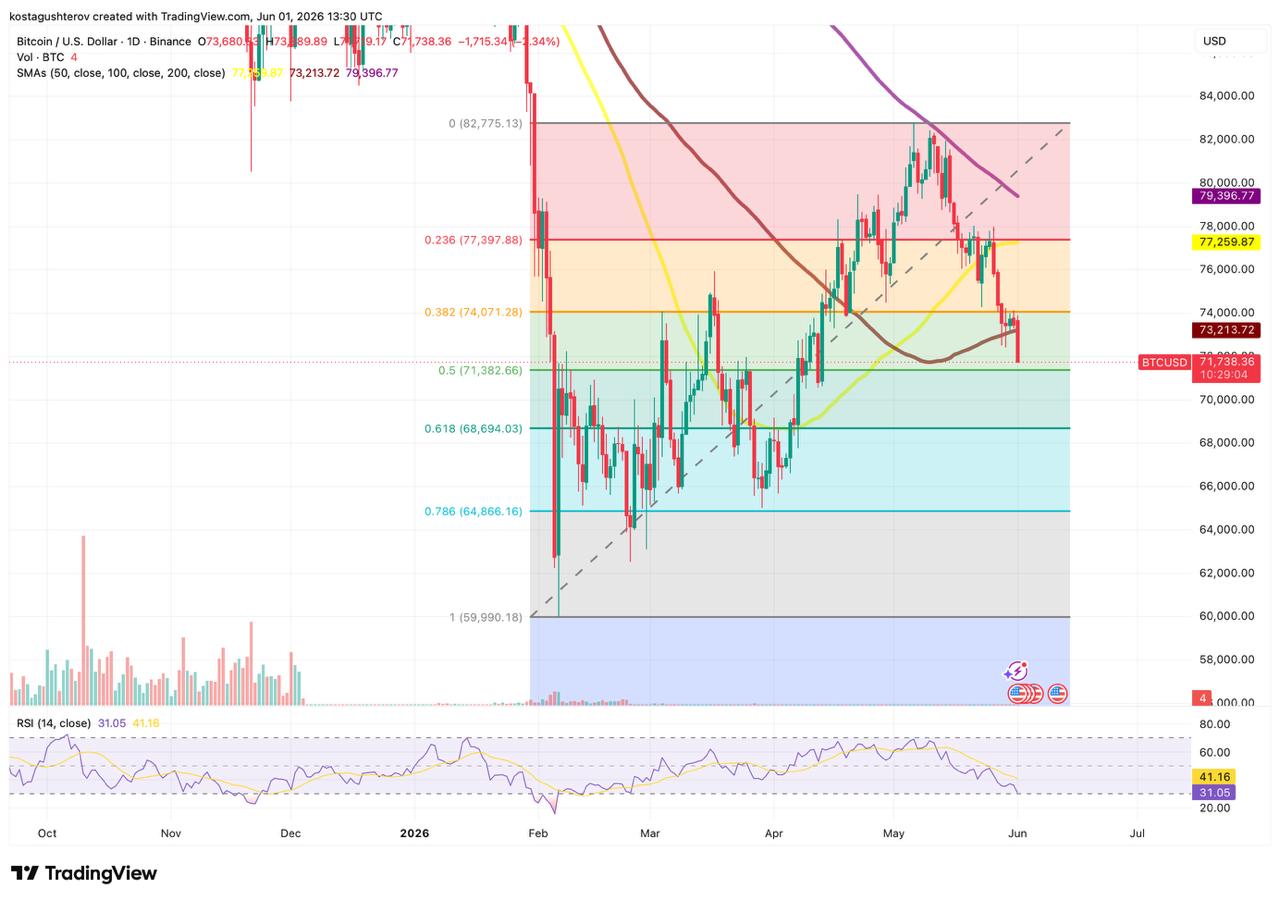
The two developments together may have pushed Bitcoin through $72,000 and down to $71,738 by mid-session, leaving it within striking distance of a level the market has been watching closely for months.
The 0.5 Fibonacci at $71,382 is less than $400 below current price. That level has functioned as both support and resistance repeatedly across the February to April period, making it one of the more tested zones on the daily chart. Arriving here quickly, without a meaningful bounce along the way, left fewer buyers with time to build positions around it before price touched down.
RSI at 31.05 on the main line is pressing into oversold territory. The last time it reached these levels was during the February crash, which ultimately preceded the recovery toward the May highs. Oversold RSI alone does not guarantee a bounce, but it does suggest selling pressure may be exhausting itself at current prices.
The 100 SMA at $73,213 has now flipped fully to resistance above, joining the 50 SMA at $77,259 and the 200 SMA at $79,396 in a wall of moving average resistance that price would need to work through on any recovery attempt.
If the Iran news keeps applying downward pressure and the 0.5 Fibonacci at $71,382 fails to hold, the next floor visible on the chart could be the 0.618 Fibonacci at $68,694. That level has not been tested since the depths of the February sell-off and reaching it from here would represent a significant further deterioration. A daily close below $71,382 could signal that the downtrend is continuing rather than pausing.
Any recovery attempt faces a layered resistance problem. The first hurdle is the 0.382 Fibonacci at $74,071. Briefly touching that level would not be enough. Price would need to break above it and hold it as support across multiple sessions before the structure starts looking constructive again. Beyond $74,071, the 50 SMA at $77,259 sits as the next major ceiling. Getting back above both levels convincingly would likely require a meaningful shift in the geopolitical backdrop, not just a technical bounce from oversold RSI.
For now the market is waiting on two things: whether Iran’s suspension of talks becomes a permanent breakdown or a temporary protest, and whether the 0.5 Fibonacci holds if price arrives at its door.
The information provided in this article is for educational purposes only and does not constitute financial, investment, or trading advice. Coindoo.com does not endorse or recommend any specific investment strategy or cryptocurrency. Always conduct your own research and consult with a licensed financial advisor before making any investment decisions.
The post Bitcoin Slides Toward $71.3K Support Following Paused Iran-US Talks appeared first on Coindoo.

