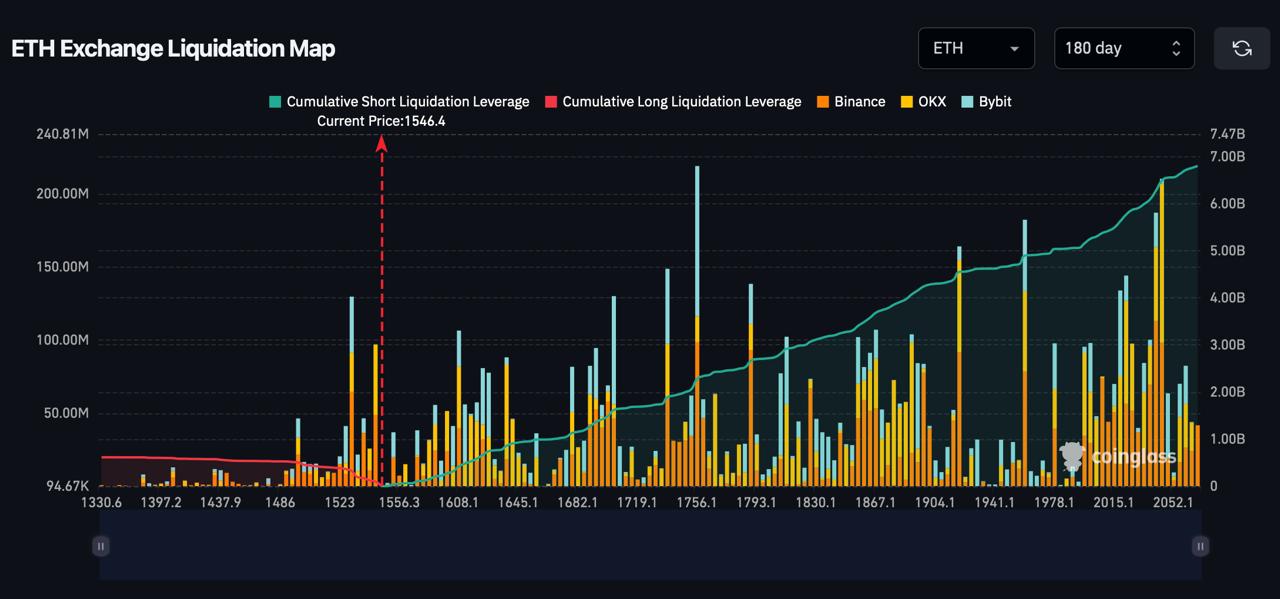
The long liquidation side below current price is thinning, not concentrated. According to Coinglass data, cumulative long liquidation leverage reaches $613.33M at $1,330, the lowest visible level, with Binance at $532.18K and OKX at $199.98K there. Closer to current price, $1,497 shows $501.24M in cumulative long liquidations (Binance $21.65M, OKX $11.46M, Bybit $13.26M), and $1,530 reaches $320.46M (Binance $64.71M, OKX $26.52M, Bybit $38.40M).
The important detail is that these are cumulative figures, the total long exposure that would be wiped if ETH fell all the way to each level, not single clusters sitting there waiting. The individual bar sizes at each level below $1,546 are small relative to the short side above, which tells the real story: most leveraged longs were already flushed during the drawdown from $1,800-plus levels. The long liquidation cascade below current price has largely been executed, and the remaining downside risk is distributed and thinning rather than concentrated.
The clearest evidence is right at current price. The largest long liquidation bar sits at $1,540-$1,556, marking $211.93M in long liquidations triggered around current levels. That cluster having already fired confirms the recent flush was real and those positions are gone. The next meaningful long liquidation level doesn’t appear until $1,486.
Above current price, the picture changes. Cumulative short liquidation leverage builds steadily from $1,546 upward, reaching $6.58B by $2,063, with the largest single concentration at $2,063.5, where $6.80B in cumulative shorts would be triggered. Short positioning is stacked consistently at every $20-40 increment between $1,550 and $2,063, with the tallest individual bar around $1,756 and another notable cluster at $1,867-$1,904.
Three levels define the structure, and the exchange breakdown at each is revealing:
The exchange concentrations sit at different prices: Bybit shorts cluster lower at $1,756, Binance spreads more evenly across the range, and OKX shorts concentrate heavily near $2,044. A move across that range would flush different exchange communities at each level rather than hitting everyone at once.
The important distinction is that this map describes potential energy, not kinetic energy. The short leverage stacked above current price means that if ETH moved upward for any reason, a macro catalyst, progress on the Clarity Act, ETF inflows reversing from current 7 week streak outflows, or a development like a final US-Iran deal resolving the open questions around enriched uranium and the Strait of Hormuz, each level is poised to mechanically force short covering, which usually tends to accelerate the move. The $1,756 cluster is the first such trigger; $2,063 is where the accumulated pressure peaks.
What the map cannot tell you is what would cause that move, when it might happen, or whether it happens at all. ETH could just as easily continue lower, in which case all that short leverage rides profit without ever being touched. The map shows where the fuel is sitting. It says nothing about whether anyone lights the match.
The post Ethereum: Where the Short-Squeeze Fuel Is Sitting appeared first on Coindoo.