Ethereum’s recovery from the $1,505 June low stalled at the exact price zone where three independent technical inputs converge. The 50-day SMA sits at $1,787, the horizontal supply shelf sourced from prior June consolidation aligns within the same handle, and the 0.236 Fibonacci retracement of the $2,465 to $1,505 decline plots at approximately $1,787. Confluence of this density typically produces the market’s first meaningful reaction on a counter-trend rally, and the current daily candle is testing whether that reaction holds.
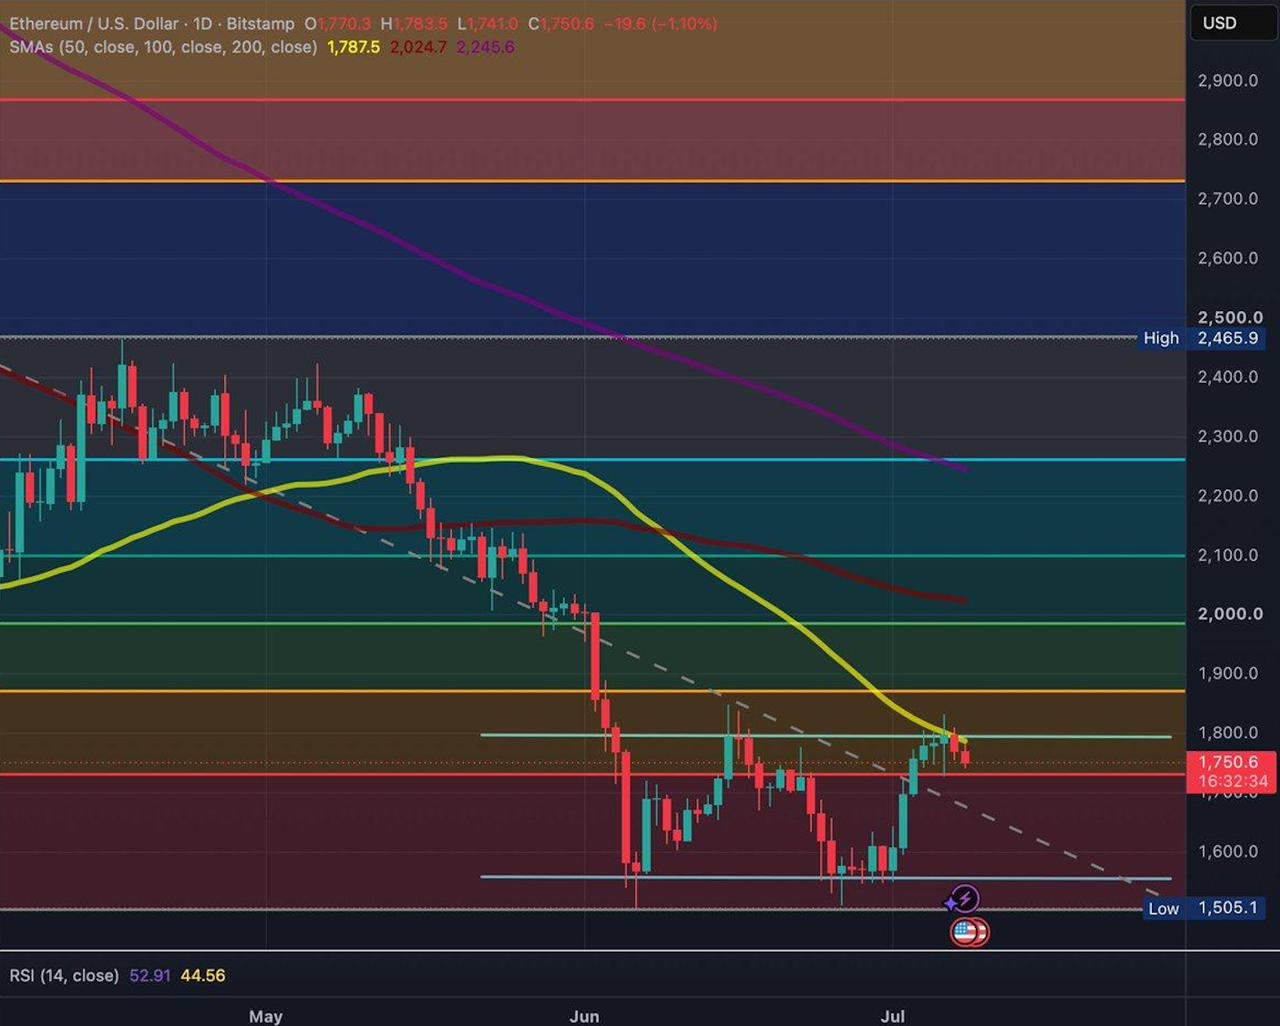
The structural read remains bearish until reclaimed. Price has traded beneath the 50 SMA throughout the June sell-off, and the 100 and 200 SMAs sit $274 and $495 above spot respectively, an alignment that historically defines distribution rather than accumulation regimes. RSI at 52.91 sits in neutral territory, offering no directional edge and confirming that momentum has not yet resolved the range.
The setup carries three specific execution risks. First, confluence zones can absorb multiple tests before resolving, and a single rejection candle is not statistically sufficient evidence of a directional outcome. Second, the 0.236 Fibonacci is the weakest of the standard retracement levels and price often slices through it toward the 0.382 near $1,872 without producing a durable rejection. Third, macro catalysts and spot ETF flow data can override technical setups on any given session, particularly when RSI sits mid-range and neither side holds momentum.
The information provided in this article is for educational and informational purposes only and should not be construed as financial advice. Cryptocurrency investments carry significant risk, and readers are encouraged to conduct their own research and consult with a qualified financial advisor before making any investment decisions.
The post Ethereum: Bulls Face Critical Point on the Daily Chart appeared first on Coindoo.