Derivatives positioning adds an important qualification. Open interest has contracted significantly, indicating that traders are reducing exposure, but funding rates remain positive. The market is less leveraged than it was near the recent open-interest peak, although the positions still open remain biased toward the bullish side.
The support being tested is more important than an isolated Fibonacci level because of the time ETH previously spent below it. Sellers controlled this area for nearly 10 days before buyers finally forced a breakout.
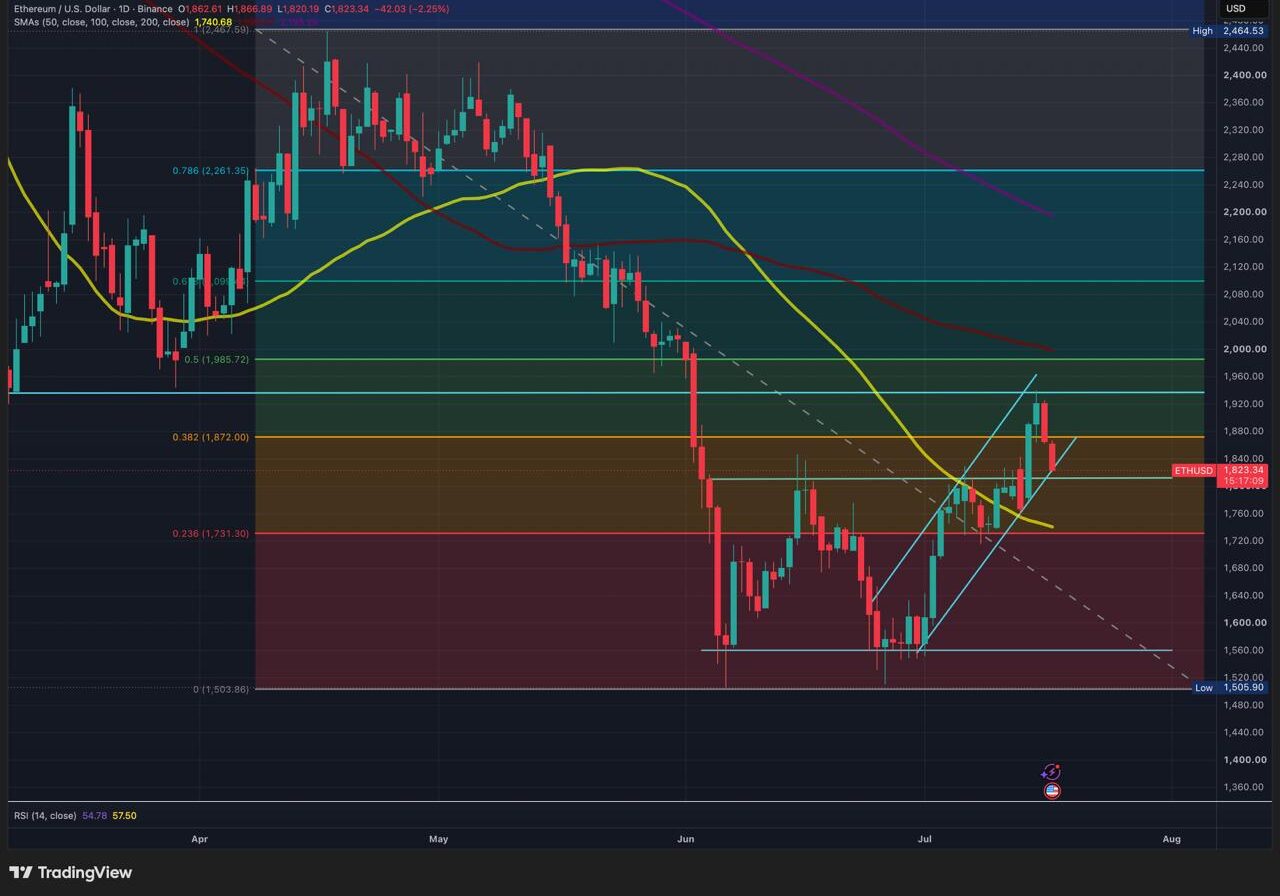
A successful retest would show that supply at the former resistance has been absorbed. ETH would then need to recover the 0.382 Fibonacci level before making another attempt at $1,930.
Failure would indicate that the breakout did not establish durable support. In that case, the 50-day SMA and the 0.236 Fibonacci retracement would form the next major area for buyers to defend.
The daily close matters more than a intraday move through the level. A temporary dip followed by a recovery would leave the structure intact, while a close below support and a failed retest would provide stronger evidence of a breakdown.
Ethereum open interest across all exchanges rose above the $15B area during the middle of the latest 90-day period before declining toward approximately $11.5B, per CryptoQuant data.
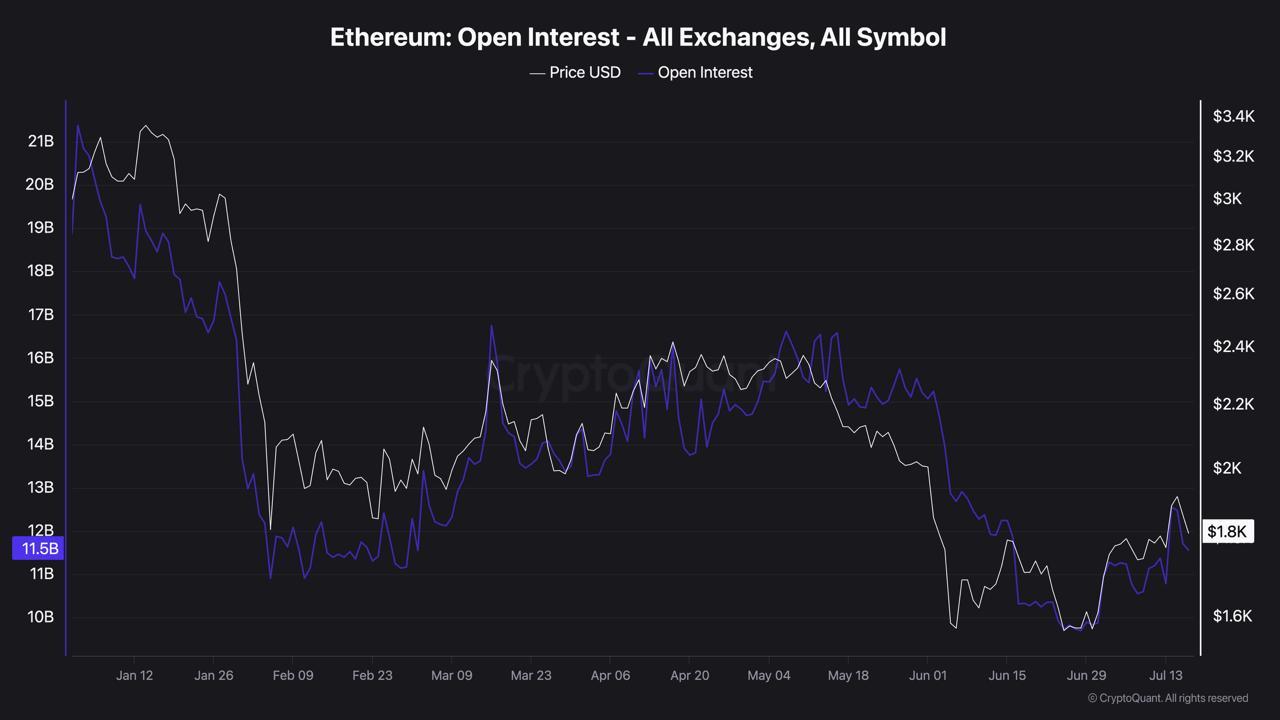
That contraction shows that traders have been closing positions rather than adding substantial new derivatives exposure. The market is therefore in a de-risking phase after the earlier build-up.
Lower open interest reduces the amount of leverage available to fuel a fresh liquidation cascade. It does not eliminate downside risk, but it means the current pullback is not developing alongside an aggressive expansion in open positions.
Funding rates provide the other half of the picture. Most readings across the latest 30 data points have remained positive, with recent values around 0.004 to 0.011. Long traders are still paying shorts, showing that perpetual positioning remains bullish overall.
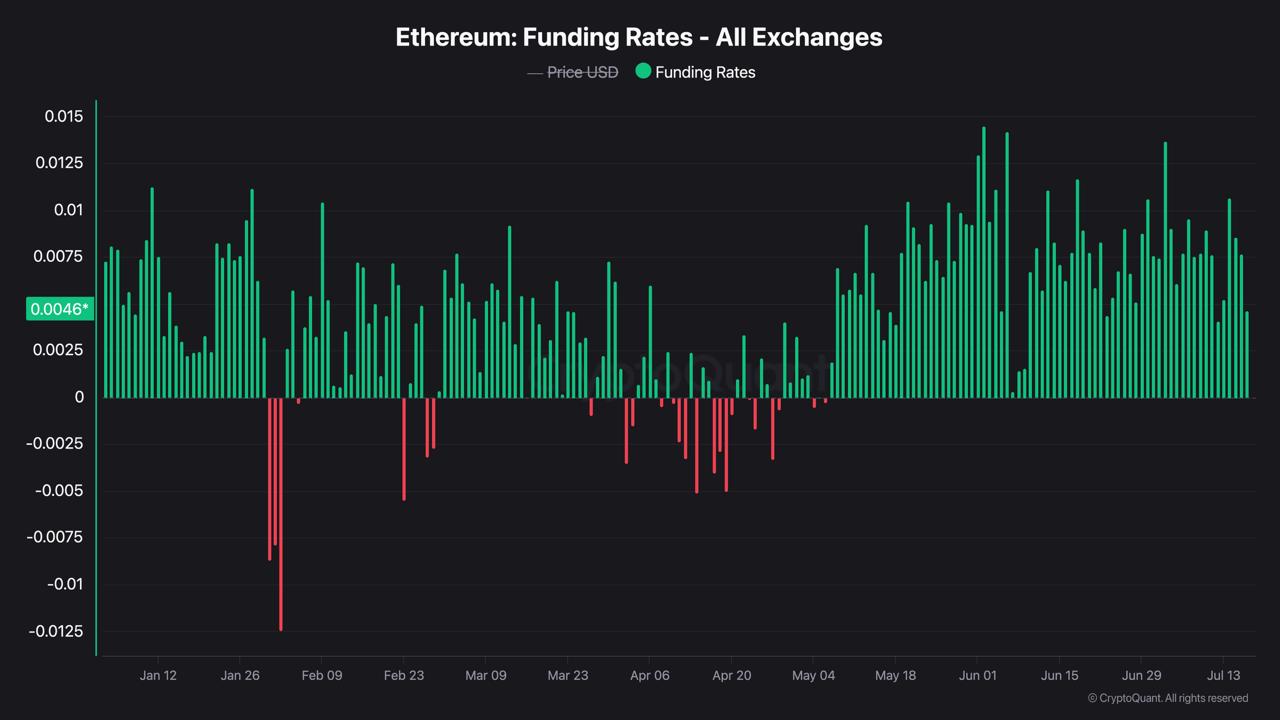
The occasional negative dips demonstrate that sentiment can reverse quickly, but the latest combination is clear:
That is a less crowded setup than rising open interest combined with strongly positive funding. The remaining risk is that a support failure forces those long-biased traders to reduce exposure further.
A recovery would be more convincing if open interest stabilizes or begins rising gradually after ETH holds support. Price bouncing while open interest continues to fall would suggest that the move lacks broad derivatives participation.
The chart already defines the key support and resistance levels. The derivatives data can show whether the next move has enough participation to continue.
Open interest has already fallen substantially from its recent peak, so the market is less leveraged overall. The next signal is whether traders begin rebuilding exposure after support holds or continue withdrawing from the derivatives market.
The information provided in this article is for educational purposes only and does not constitute financial, investment, or trading advice.
The post Ethereum Loses Key Fib Level as Open Interest Slides to $11.5B appeared first on Coindoo.





