Ethereum posted a substantial 5% gain on Thursday, September 4, driving the price toward $2,508. This breakout followed an extended consolidation phase confined between $2,400 and $2,560 support and resistance levels.
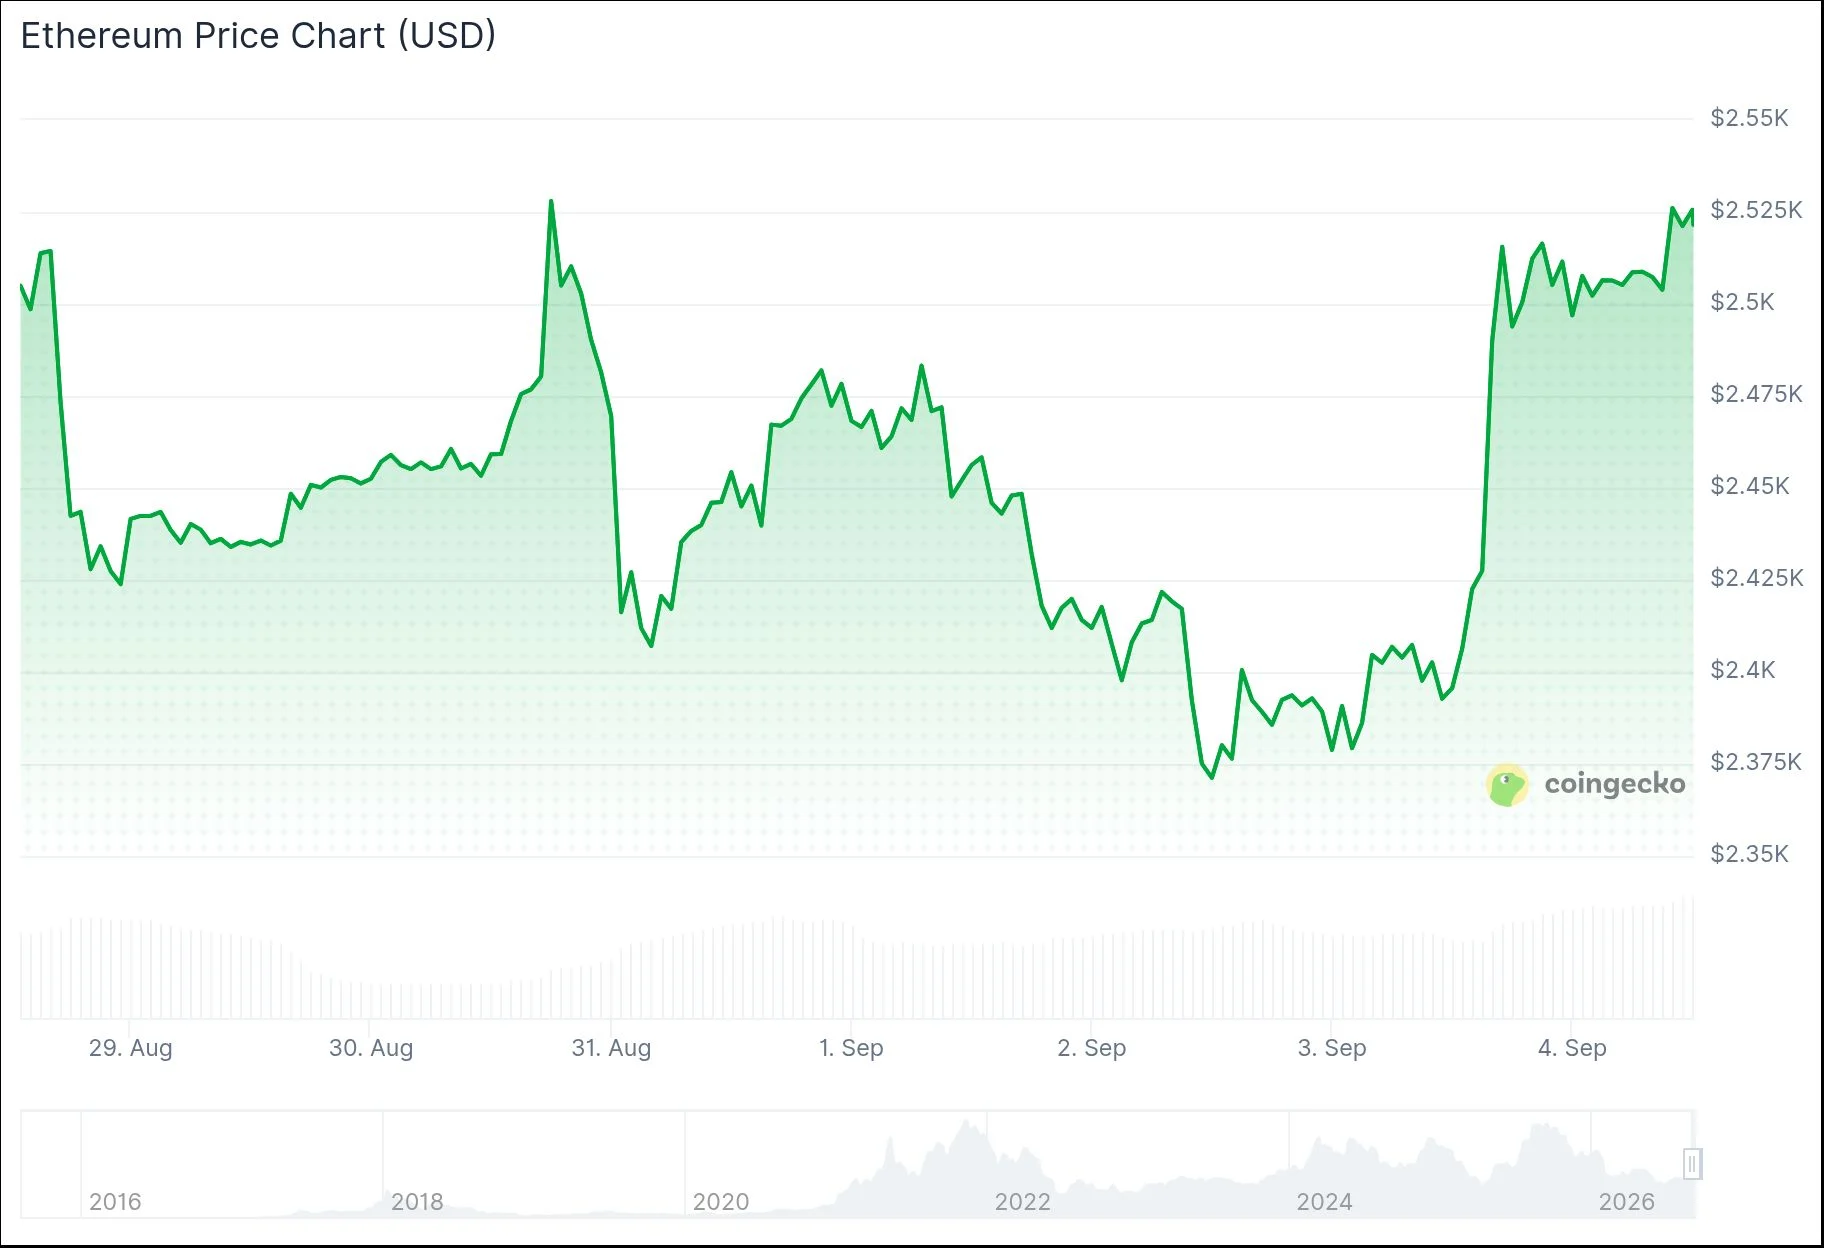
The upward momentum wasn’t tied to Ethereum-specific developments. Instead, two broader macroeconomic catalysts influenced market sentiment. Initially, emerging reports indicated potential de-escalation in US-Iran tensions, alleviating risk-averse positioning throughout financial markets. Additionally, Federal Reserve Governor Christopher Waller dampened September rate hike speculation, stating “Give disinflation a chance. We can wait one meeting.”
Disappointing employment figures reinforced this dovish outlook. The ADP report revealed US private sector employers added merely 38,000 positions in August, falling short of the 47,000 forecast and marking the weakest performance since January. Market-implied probability of a September rate increase tumbled from 70% to 50%.
Market analyst Ted Pillows (@TedPillows) observed on X that Ethereum reached the $2,550 resistance barrier before encountering selling pressure. He suggested that a weekly closing price exceeding $2,550 might catalyze a move toward the $3,000 threshold.
Following a $48.08 million withdrawal on September 2, spot Ethereum ETF products experienced a significant turnaround. September 3 witnessed net inflows totaling $141.39 million. BlackRock’s ETHA product dominated with $72.07 million in new capital, while Fidelity’s FETH contributed $65.11 million. Grayscale’s ETHE continued bleeding assets with $6.07 million in outflows. Total accumulated inflows across all Ethereum exchange-traded products have reached $13.17 billion.
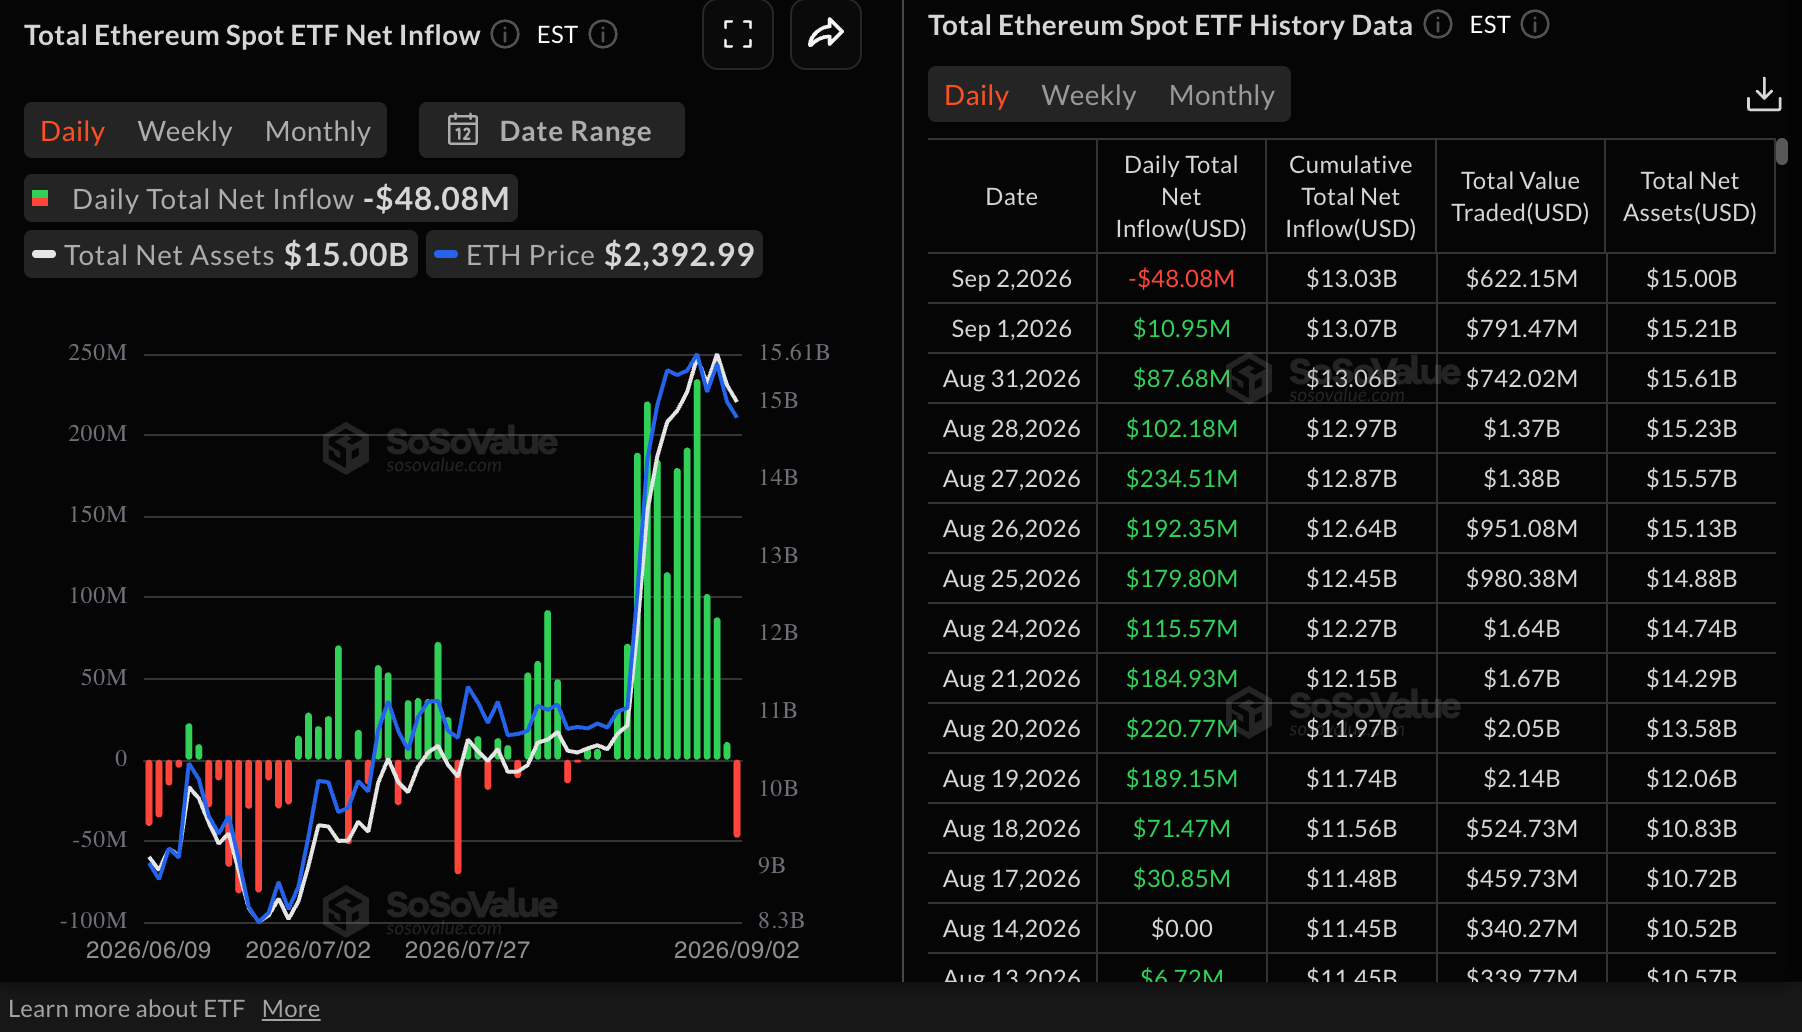
The correlation between ETF activity and spot market performance remained tight across both sessions, with price movements mirroring fund flow patterns nearly perfectly during both the decline and subsequent recovery.
Trading volume in ETH derivatives contracts expanded 17.84% to reach $57.18 billion over the 24-hour period. Open interest increased 5.36% to $34.13 billion. Short position liquidations totaled $82.41 million compared with just $20.76 million for long positions — evidence of an aggressive short squeeze.
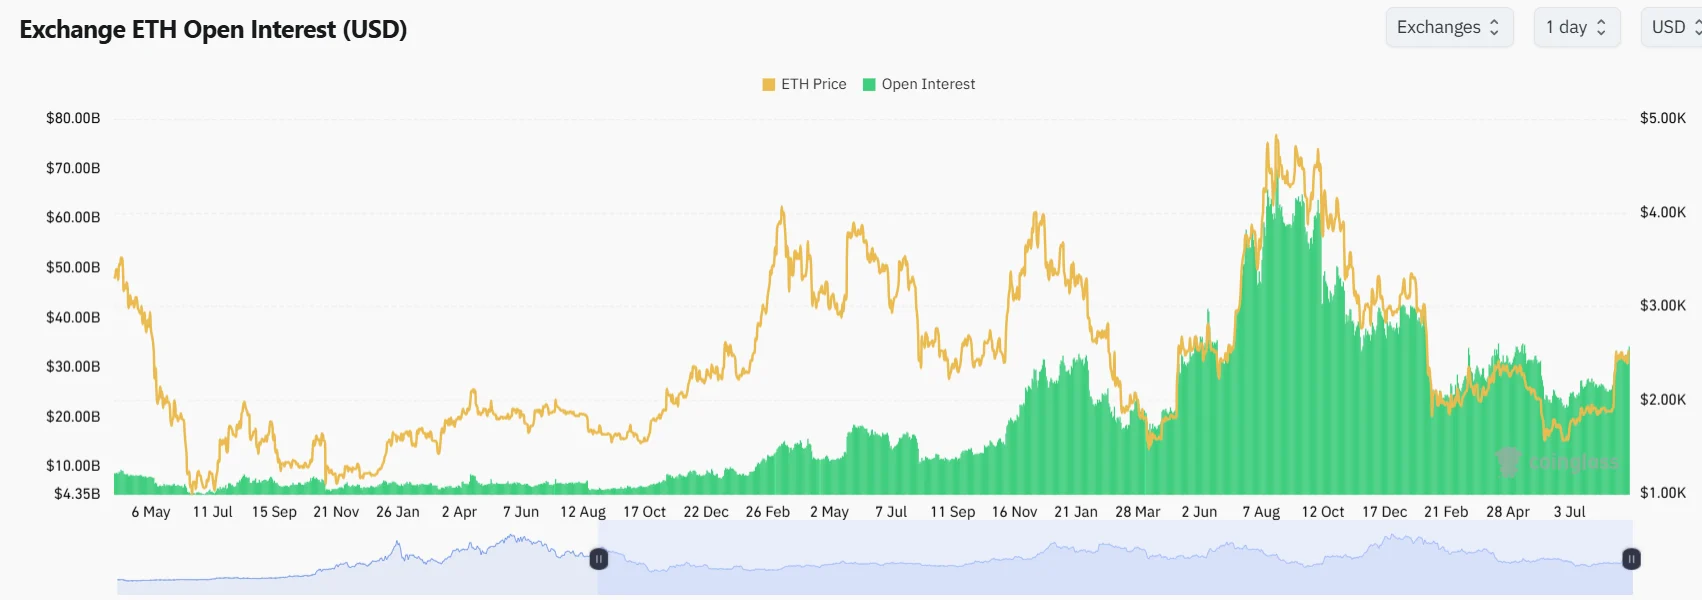
However, the most recent hourly data revealed a shift in dynamics. Long positions suffered $193,090 in liquidations against only $33,200 for shorts, indicating heightened two-way volatility rather than sustained directional momentum.
Ethereum currently trades above all four key exponential moving averages. The 20-period EMA stands at $2,455.94, the 50-period at $2,438.36, the 100-period at $2,363.41, and the 200-period at $2,222.64. The upper boundary near $2,560 has consistently repelled advance attempts since August 27, including a brief spike to $2,555 on August 28 that quickly reversed.
ETF inflows reversed decisively to $141.39 million on September 3, pushing cumulative flows across all US-listed Ethereum investment vehicles to $13.17 billion.
The post Ethereum (ETH) Climbs 5% as $141M ETF Inflows Trigger Short Squeeze appeared first on Blockonomi.





