The pennant pattern is a continuation chart formation frequently observed in forex and CFD markets during periods of strong directional momentum. It develops after a sharp price movement followed by a brief consolidation phase, reflecting temporary equilibrium before potential trend continuation.
Unlike reversal patterns, a pennant forms within an existing trend structure and is commonly used by traders to analyse breakout conditions, organise entry planning, and define risk parameters using measurable price projections. The pattern’s compact structure allows market participants to evaluate volatility contraction and subsequent expansion within a clearly defined technical framework.
This article examines how bullish and bearish pennant patterns are identified across different market environments, how breakout scenarios are evaluated step by step, how price targets are derived using the flagpole measurement method, and how false breakouts can be filtered through confirmation techniques and professional trading tools.
A pennant pattern is a short-term continuation chart formation that develops after a sharp directional price move and signals a potential breakout in the direction of the prevailing trend. The pennant pattern’s structure is:
Pennants reflect a pause in momentum rather than a structural reversal.
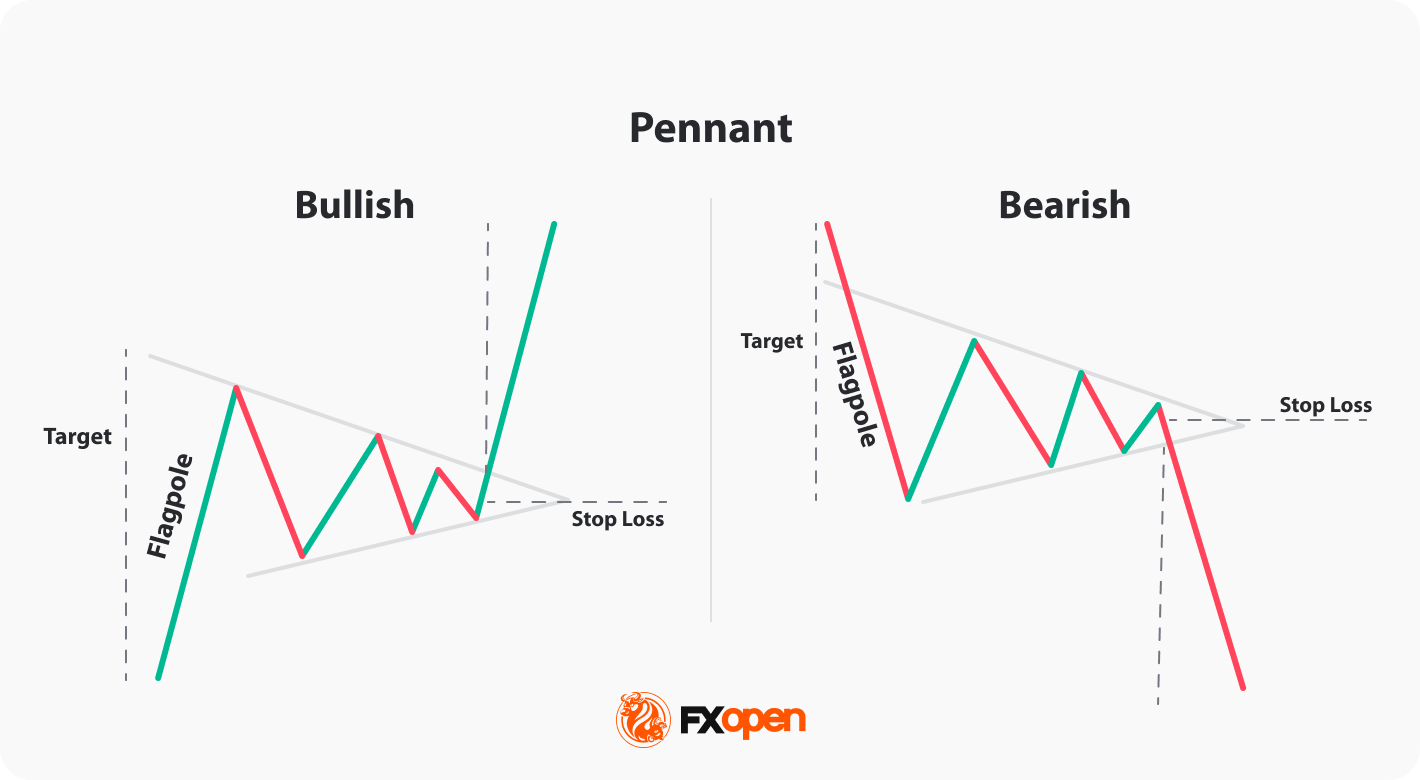
A bullish pennant pattern forms after a strong upward impulse. The consolidation appears as a small symmetrical triangle sloping slightly against the prior trend. A breakout above the upper boundary signals potential continuation higher.
This setup frequently appears in trending currency pairs such as EUR/USD during macro-driven momentum phases.
A bearish pennant develops after a sharp decline. Price consolidates within converging trendlines before breaking below the lower boundary, indicating further downside continuation.
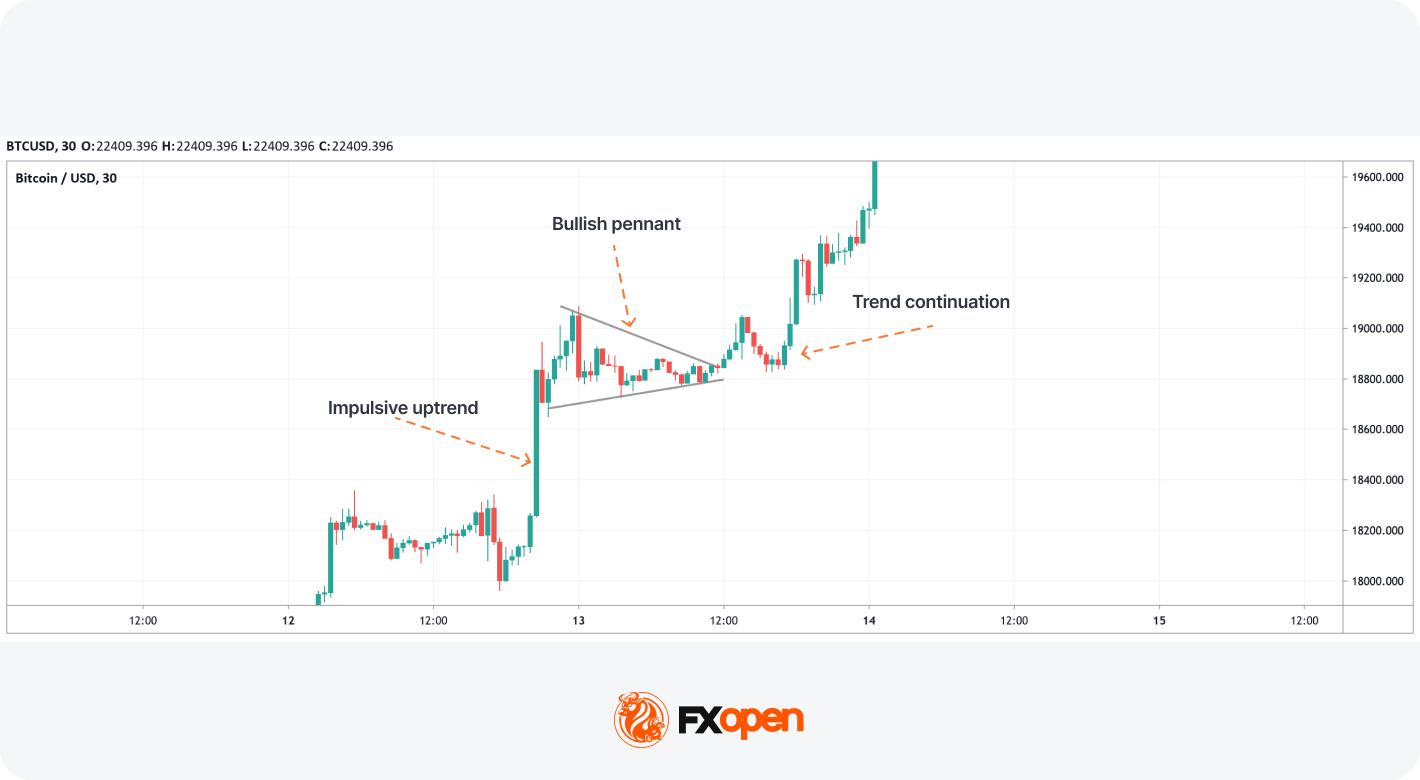
In high-volatility markets such as cryptocurrencies*, bearish pennant trading setups often form during strong sentiment-driven selloffs.
How Pennant Patterns Form in Live Forex & CFD Markets
In real market environments, pennants often develop during:
The initial impulse creates directional imbalance. During consolidation, volatility contracts and volume typically declines. As price compresses, stop orders accumulate outside the structure. The breakout phase triggers these orders, accelerating momentum through volatility expansion.
This contraction-to-expansion transition is the core edge of pennant trading strategies.
Pennant Pattern Checklist for Traders
Identifying a valid pennant pattern requires precision. Not every consolidation qualifies.
If you would like to find the formations yourself, consider using the TickTrader trading platform with over 700 instruments and 1200 trading tools.
A valid pennant begins with a sharp, one-sided move supported by expanding momentum.
Without a strong flagpole, the pattern loses statistical edge.
Characteristics:
Breakout should:
Traders avoid entering inside the pattern. The setup becomes valid only after confirmed breakout structure not to be trapped by false breakouts.
Breakouts during major news events may cause slippage and spread widening.
Professional traders typically choose between:
Use the flagpole projection method:
Alternative targets:
Common stop-loss placements:
Additional risk management considerations:
Traders don’t trade if:
To understand how a pennant pattern works in live market conditions, let’s examine a structured bullish breakout example on EUR/USD.
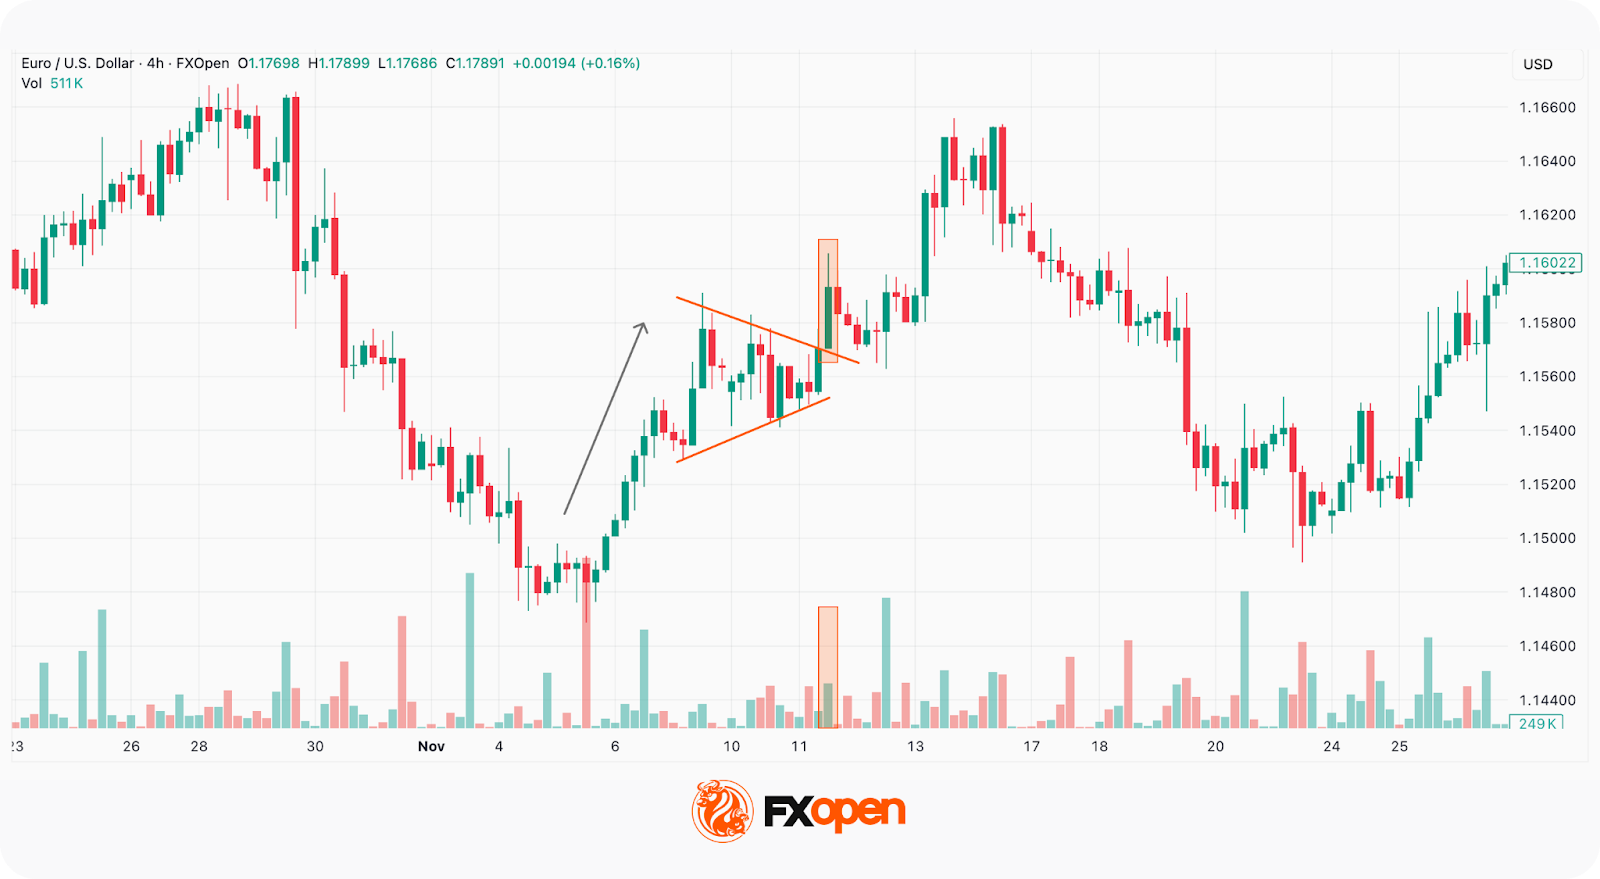
The downtrend reversed with a solid upward momentum. Although there was no confirmation on a higher timeframe, traders could consider trading the pennant pattern.
A strong, impulsive bullish move developed over two days with large-bodied candles and no pullbacks. This created the flagpole, establishing directional bias.
Following the impulse, the price entered a tight consolidation, with converging trendlines forming and momentum temporarily pausing. This compression phase lasted for several days.
The breakout occurred in the direction of the prior trend with a strong bullish candle close.
Aggressive traders could enter on a breakout close. Conservative traders could wait for a retest of the broken resistance.
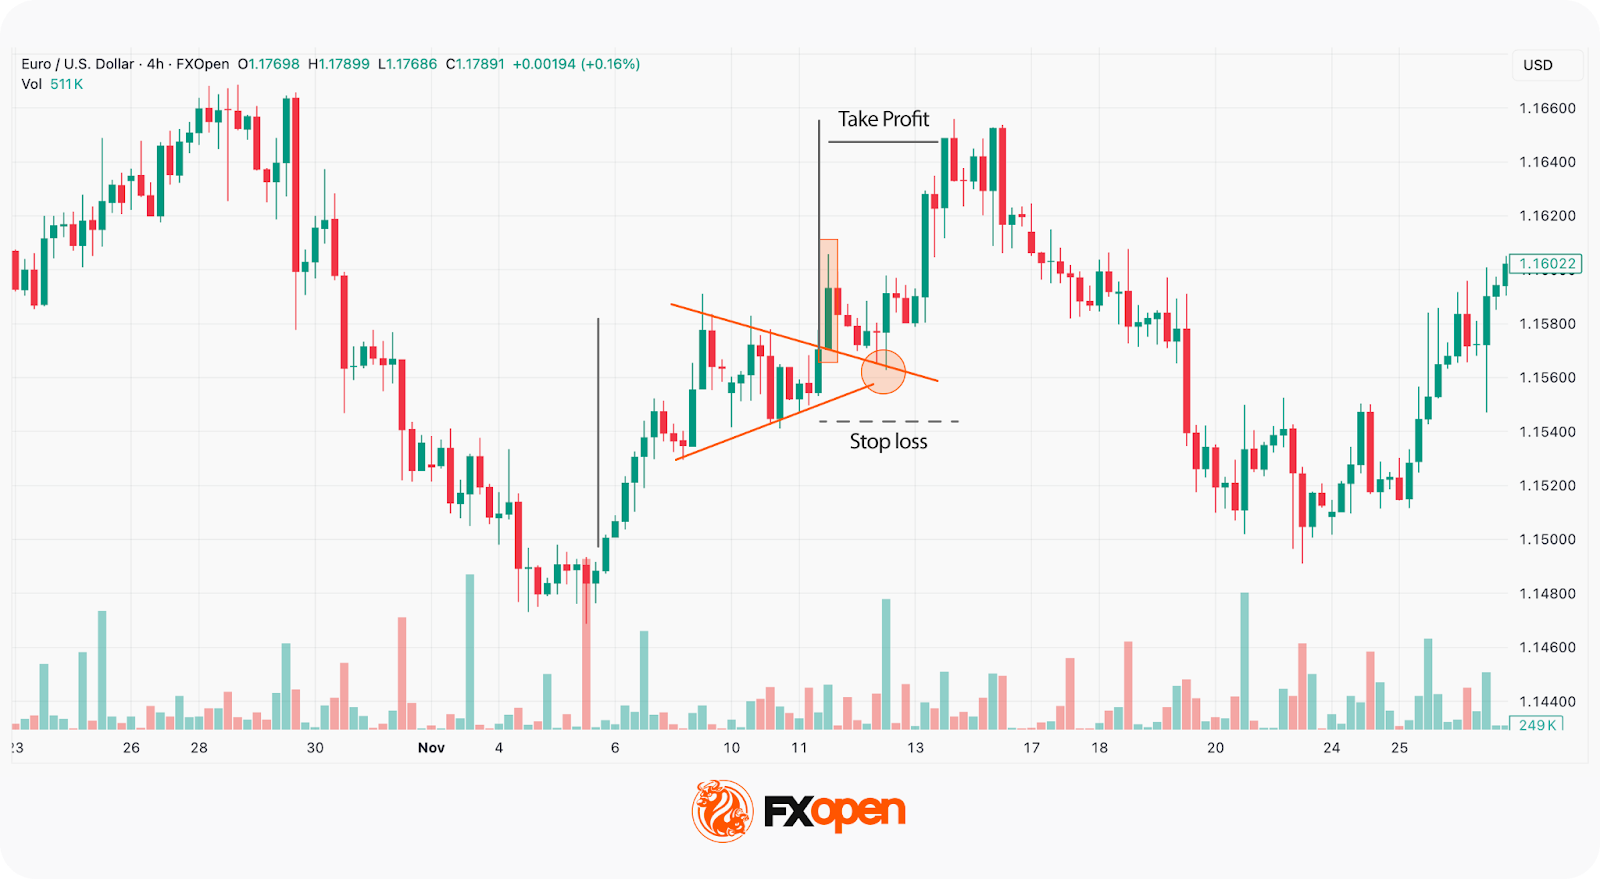
Entry: Traders could enter at a retest of the broken trendline
Stop-Loss: Below the lower boundary
Target: Flagpole projection method, but with amendments. Although one of the rules states that the price is supposed to rise as far as the length of the flagpole, markets aren’t perfect. Therefore, many traders prefer to set a smaller target, taking into account recent price movements.
This example aligned with several high-probability conditions:
The setup demonstrates that pennants are not traded based on shape alone — they require context, confirmation, and disciplined execution.
You can test your own strategies across more than 700 instruments at FXOpen’s TickTrader trading platform.
Professional traders evaluate pennant formations within a broader market framework rather than as isolated chart patterns. Pattern performance is primarily influenced by objective market conditions, including:
Trade outcomes, however, also depend on execution variables specific to the trader, such as:
According to research by Thomas Bulkowski in Encyclopedia of Chart Patterns, pennants are classified as moderately reliable continuation patterns.
In trending environments, measured-move targets are frequently achieved. In low-liquidity or sideways markets, failure rates increase.
Timeframe affects pattern’s reliability:
According to Thomas Bulkowski’s Encyclopedia of Chart Patterns, pennants form within up to 3 weeks. They are shorter than symmetrical triangles and wedges.
Brian Shannon explains how to trade in multiple timeframes in his Technical Analysis Using Multiple Timeframes.
Understanding structural distinctions between pennant pattern vs flag pattern vs symmetrical triangle pattern might improve trade selection and risk control.
Pattern | Structure | Context | Breakout Bias |
Pennant | Converging trendlines | Momentum pause | Prior trend |
Flag | Parallel channel | Controlled pullback | Prior trend |
Symmetrical Triangle | Converging trendlines | Neutral | Either |
Pennants differ from flags in that they show price compression rather than gradual retracement. Compared to symmetrical triangles, pennants are smaller and typically form over shorter durations during high-momentum conditions.
John Murphy widely explains the difference between pennant and flag patterns in his book Technical Analysis of the Financial Markets.
Even experienced traders misinterpret compression structures. Frequent errors include:
Pattern shape alone is insufficient. Context and confirmation determine the edge.
Pennants are useful in strong trending markets, but they’re not perfect. Let’s take a look at the formation’s advantages and disadvantages.
Like any pattern, the pennant isn’t foolproof. However, traders use certain methods when building a trading strategy around pennants.
Pennants are used in strong trends. You can use tools like moving averages to confirm them. For example, if the price is above the 50-period EMA and the pennant forms during a steady uptrend, that adds weight. A breakout above a short-term moving average can strengthen the case.
Momentum indicators can also help. If the Relative Strength Index (RSI) sits comfortably above 50 while the bullish pattern forms, or breaks out above 50 alongside the pennant, that can confirm a bullish trend and vice versa. However, if the RSI shows overbought/oversold conditions and the market does look very overstretched, that might be a sign to hold off or manage risk more carefully.
Volume can give clues. During the pennant, volume may dry up and signal a pause. However, if the breakout coincides with strong volume, that can show genuine interest as buyers or sellers rush in to take advantage of a possible new trend leg. If it stays low, the move may fail or reverse due to a fake breakout.
A pennant is just part of a broader story. For instance, if the market is bouncing off of a resistance level, creates an impulsive flagpole and then forms a bear pennant, that might add conviction to the pattern. However, if the breakout is straight into a major support level, traders might consider looking for a bullish reversal pattern instead.
Alignment between timeframes and correlated assets can be valuable too. If a pennant on the 1-hour chart occurs during a larger trend on the daily, that may add weight. Likewise, if there’s a bullish pennant forming on EUR/USD while dollar weakness is apparent across the board, there might be a higher probability that the bullish breakout is genuine.
The pennant pattern is a valuable tool, which provides useful insights into potential price trends. However, it may provide false signals; therefore, to trade with a pennant, you need to be familiar with technical analysis and be able to interpret charts.
You can explore live charts and apply these techniques using the FXOpen TickTrader platform, which provides 700+ instruments and advanced charting tools.
Consider opening an FXOpen account today and trade forex and CFDs on indices, commodities, and crypto* with:
The pennant meaning refers to a short-term continuation pattern that forms after a sharp price move. It’s made up of a brief consolidation phase with converging trendlines, then followed by a breakout in the same direction as the original move. It can signal an impending continuation trend leg.
Traders usually wait for the price to break out of the pennant on rising volume in the same direction as the initial move. The height of the flagpole is typically used as a rough target, while stop losses are set beyond the last swing high/low or opposite pattern’s boundary.
A bullish pennant typically leads to further upside if the price breaks above the pattern’s upper trendline with strong momentum.
Bull flags and bull pennants both follow strong upward moves and signal a trend continuation. The key difference between a pennant and a flag is structure. The price in a flag drifts lower or moves sideways within parallel lines that form a sloping or horizontal channel. The price in a pennant contracts into a small symmetrical triangle with converging trendlines.
*Important: At FXOpen UK, Cryptocurrency trading via CFDs is only available to our Professional clients. They are not available for trading by Retail clients. To find out more information about how this may affect you, please get in touch with our team.
**Additional fees may apply.

