The price has recovered substantially from the June low near $60, but it remains inside the $73 to $84 range that has controlled trading since the crash. SOL is also sitting just below its flat 100-day simple moving average at $79, placing the market directly beneath its first meaningful resistance.
At the same time, Solana spot ETFs have recorded four consecutive positive weekly readings, creating a more supportive flow backdrop while the chart remains unresolved.
The four-week sequence shows uninterrupted net inflows into Solana spot ETFs, but the size of those inflows has changed considerably.
| Weekly Reading | Total Net Inflow |
|---|---|
| July 21, 2026 | $8.47 million |
| July 17, 2026 | $948,210 |
| July 10, 2026 | $930,430 |
| July 2, 2026 | $5.75 million |
The latest $8.47 million total came from $2.64 million on July 20 and another $5.83 million on July 21, per SoSoValue data. Those two days alone brought in more than the approximately $7.63 million recorded across the previous three positive weekly readings combined.
The concentration of demand in the latest period strengthens the flow signal, but ETF inflows do not automatically resolve the price structure. SOL remains below the resistance levels that have repeatedly contained the recovery, meaning the data supports the base without confirming a breakout.
The June decline pushed Solana toward $60 before buyers established a recovery. Since then, price has formed a sequence of higher lows, but every stronger advance has stalled beneath the upper part of the current range.
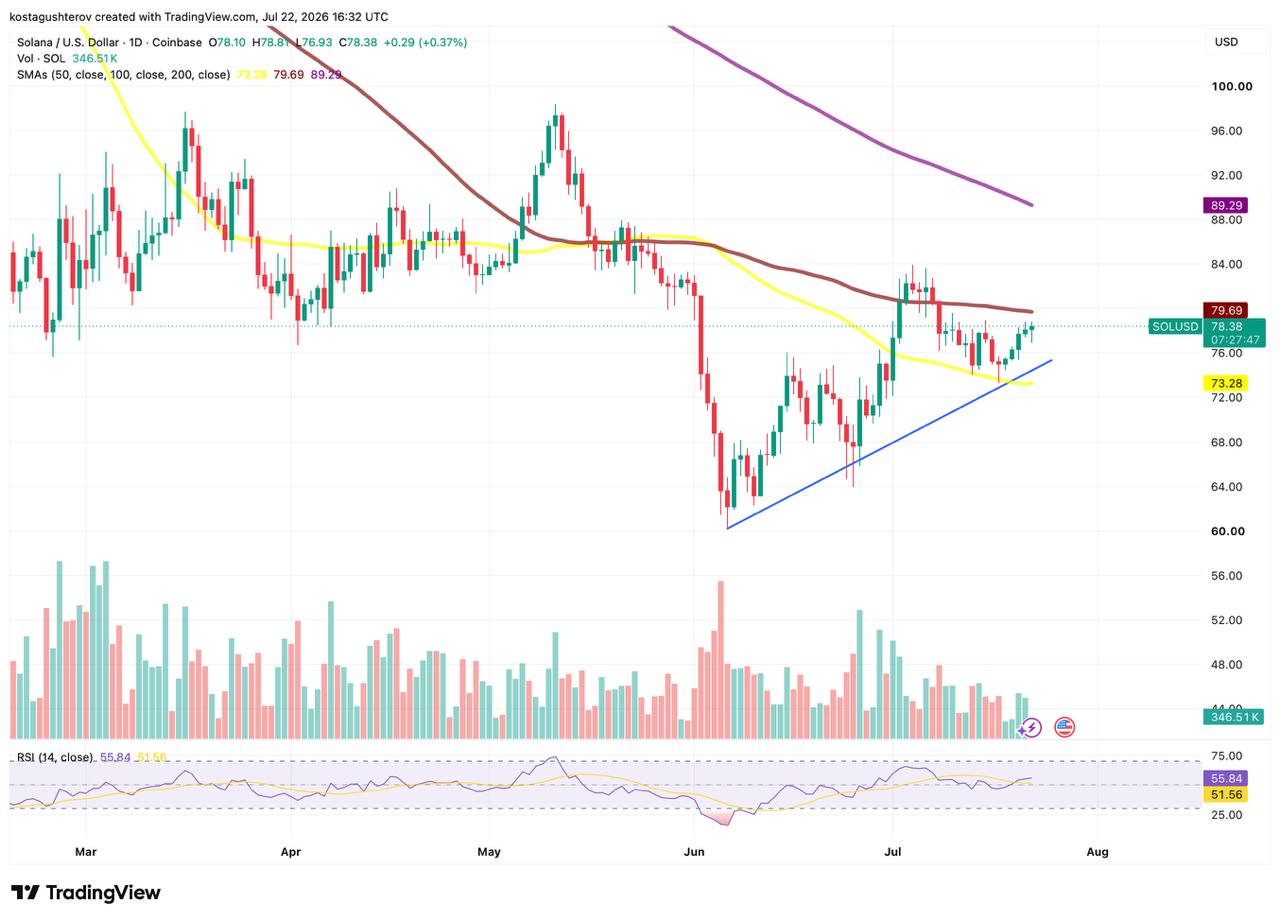
The result is a sideways consolidation between approximately $73 and $84. The rising 50-day simple moving average at $73 now overlaps with the lower boundary, giving the range floor both horizontal and moving-average support.
SOL is positioned near the middle of that structure rather than at either extreme. That limits the significance of small daily moves around $78, as price is neither breaking resistance nor threatening the base.
The flat 100-day average reinforces the neutral reading. Its position directly above the market shows that the earlier downtrend has lost some momentum, but it has not yet been replaced by a confirmed uptrend.
The first test is the 100-day average at $79. A daily close above it would move SOL out of the middle of the range and reopen the path toward $84, where the recovery stalled around the middle of July.
Reclaiming it would improve the short-term structure, but the more important confirmation sits at the range ceiling. A move above $84 with stronger volume would produce the first higher high since May.
That would change the character of the recovery. Instead of continuing to rotate between established support and resistance, SOL would begin breaking the sequence that has kept it under pressure since the earlier highs.
The falling 200-day simple moving average at $89 would then become the next visible obstacle, testing whether the market can extend beyond a range breakout into a broader trend reversal.
The relative strength index is near 55, leaving room for price to move in either direction. Momentum is neither overbought nor deeply weakened, so the outcome is more likely to depend on how SOL reacts at 100 SMA and $84 than on an extreme indicator reading.
The $73 area combines the range floor with the rising 50-day average, making it the level that protects the recovery from returning to its June structure.
That loss would expose the lower recovery zone near $66, followed by the June base around $60. A return to those levels would show that the recent consolidation failed to establish a durable floor.
Solana is approaching the expected activation window for its Alpenglow consensus upgrade, scheduled for mainnet between August and October 2026.
The timing remains contingent on the release of the Agave 4.2 client and sufficient validator key registrations to complete the required testing and security audits.
Alpenglow represents a complete overhaul of Solana’s consensus layer, replacing Proof of History and Tower BFT. The approaching upgrade could attract additional market attention while ETF inflows are strengthening.
However, the event would not confirm that the range has ended while SOL remains below $79 and $84. A stronger response would require continued ETF demand, a reclaim of the 100-day average and enough volume to clear the July ceiling. Without that combination, Alpenglow may strengthen the narrative around Solana while price continues moving sideways.
Solana’s backdrop is becoming more constructive, but the price has not yet followed with the same conviction. ETF demand is strengthening and Alpenglow provides a potential catalyst, while the chart remains confined beneath its main resistance levels.
The structure therefore stays neutral until the range resolves. Buyers have protected the recovery so far, but only a confirmed move through the upper boundary would turn the consolidation into something more durable.
This article is provided for informational purposes only and does not constitute financial, investment or legal advice.
The post Solana Nears $80, but a Tougher Test Lies Ahead appeared first on Coindoo.