HYPE reached an all-time high near $86.80 before retreating toward $81.30. The pullback came as interest-rate traders sharply increased their expectations for another Federal Reserve hike.
Expectations for a September hike strengthened throughout the day. Earlier Reuters reported that the probability initially rose from roughly 35% to 50%. By the time of writing, the CME FedWatch Tool placed the odds of a 25-basis-point increase at the September 16 meeting at 59.7%. Such a move would lift the target range from 3.50%-3.75% to 3.75%-4.00%, while the remaining probability pointed to no change and no rate cut was priced in.
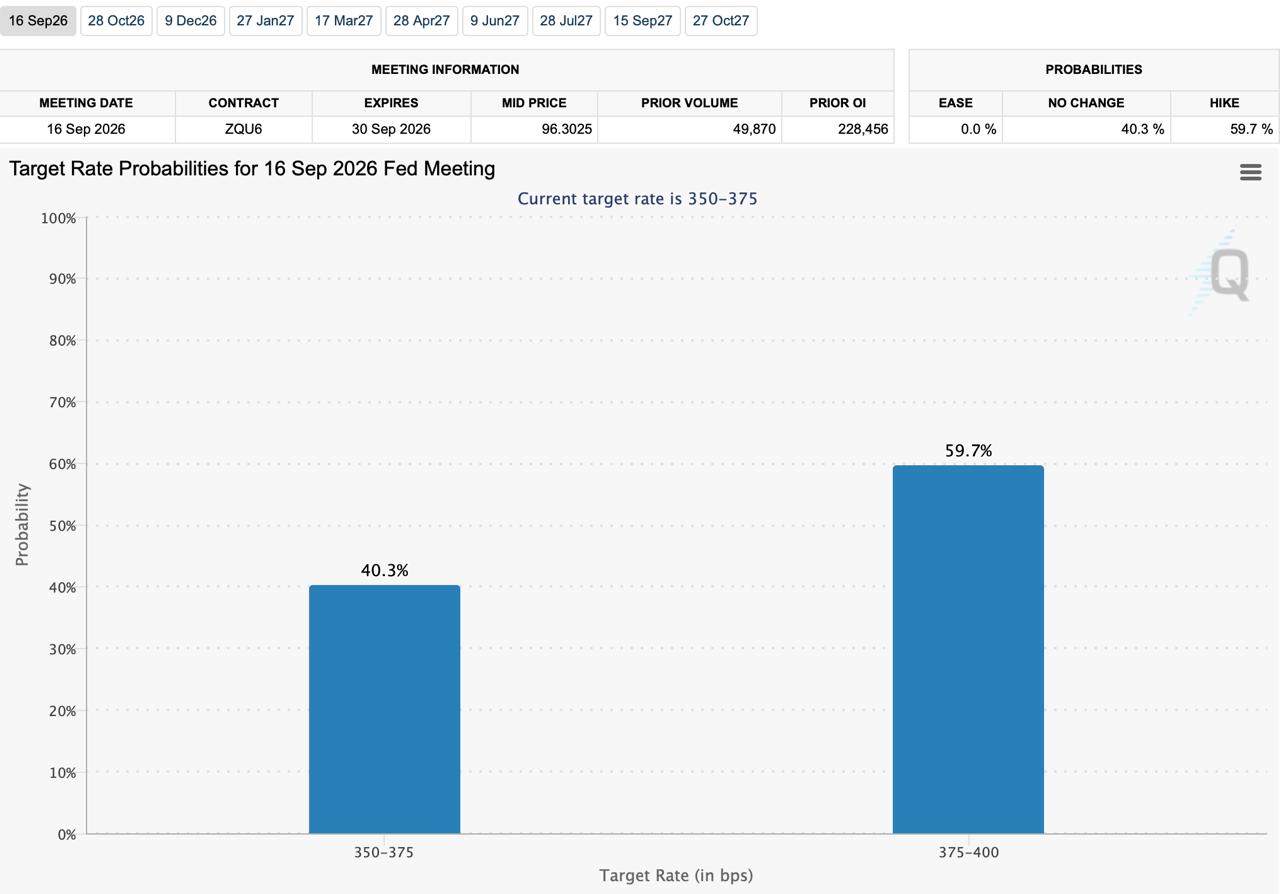
The change followed Federal Reserve Chair Kevin Warsh’s Jackson Hole address. Warsh said inflation remained above the Fed’s 2% objective and that policymakers had “work to do” unless the underlying trend moved clearly and quickly toward that target. His complete remarks are available through the Federal Reserve.
Higher rates increase the return available from cash and short-term government debt while making leveraged positions more expensive. That backdrop is particularly relevant to HYPE after a roughly 70% advance from $51 to its $86.80 record left the token exposed to profit-taking.
The timing makes the shift in rate expectations relevant, although price action cannot establish it as the sole cause of the pullback.
HYPE remaines inside its ascending daily channel near $81.30 at the time of writing. The decline brought price back toward the lower trendline in the low-$80 area, where buyers must defend the latest higher low to preserve the channel structure.
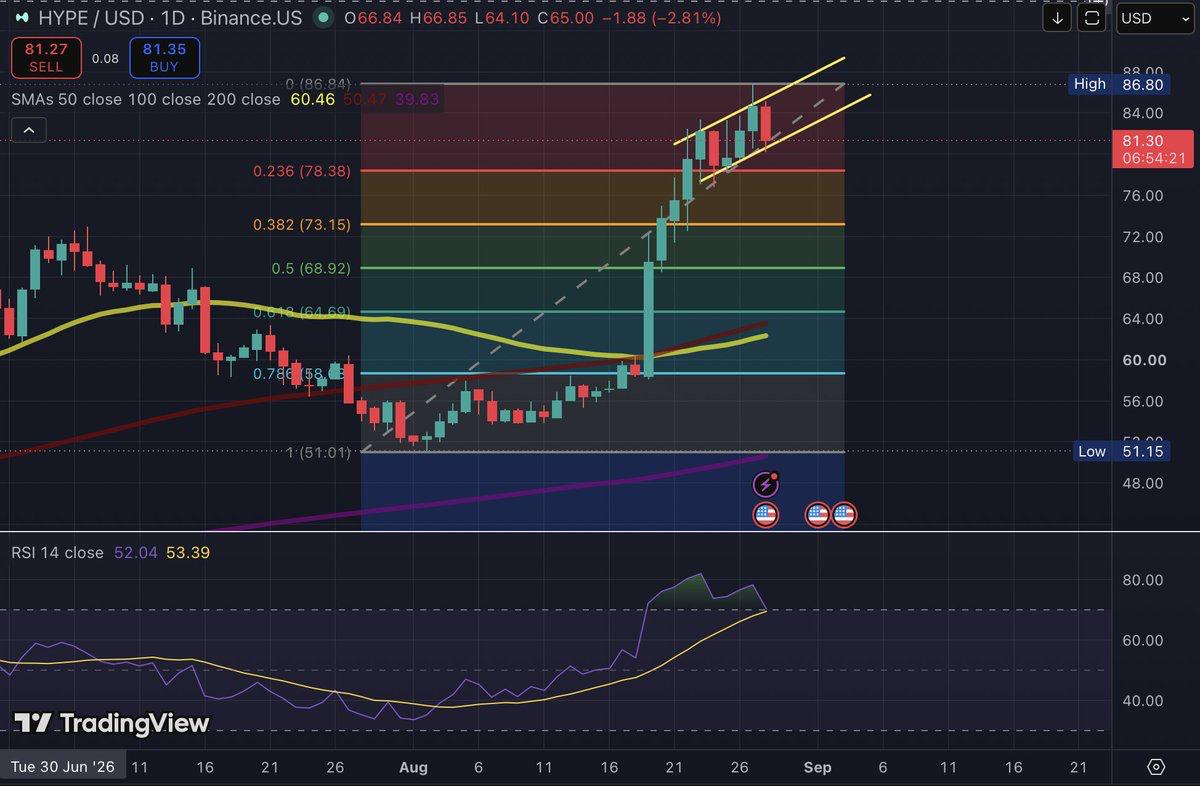
The wider trend remains upward, with HYPE trading well above its 50- and 100-day simple moving averages near $60.50. Their distance from the current price also shows how quickly the token climbed during August. Neither average is close enough to provide immediate support during the current pullback.
The first major horizontal level sits near $78, representing the 0.236 Fibonacci retracement of the advance from $51 to $86.80. Together with the lower channel boundary, it creates a broader support zone extending from the high-$70s into the low-$80s.
Momentum presents a separate warning. HYPE formed higher price highs during the final stage of the rally, while the daily Relative Strength Index produced lower highs. This bearish divergence indicates that momentum weakened as the token approached its record.
The divergence can persist during a strong uptrend and does not confirm a reversal by itself. An intraday move below the trendline would also carry limited weight if buyers reclaimed it before the daily close. A sustained daily close below $78 would provide stronger evidence of a deeper correction and expose the next Fibonacci support near $73.
The shorter timeframe offers a more constructive signal. HYPE reacted above its rising 50-period simple moving average near $79.50 and remained inside the four-hour ascending channel. The latest candle recovered from a low near $80.20 toward $81.50, preserving the immediate support structure.
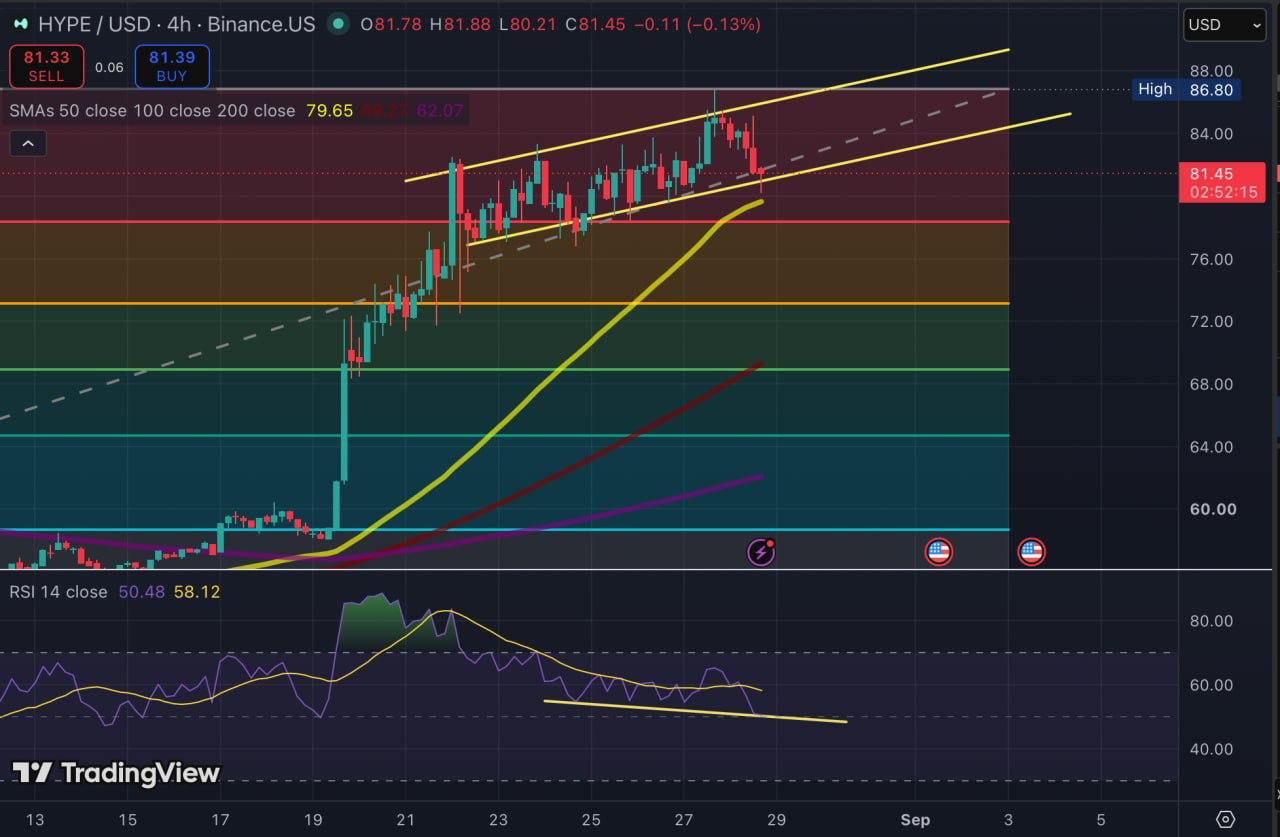
The four-hour RSI formed a hidden bullish divergence as price produced a higher low inside the channel while RSI moved to a lower low. This pattern can appear during a temporary correction within an established uptrend.
Continued closes above the 50-SMA would keep the rebound setup active. Buyers would then need to carry HYPE through the middle of the channel and above $84 to show that the move has developed beyond an initial reaction from support.
The four-hour signal does not erase the weaker momentum on the daily chart. HYPE can produce a short-term rebound while its broader momentum continues to deteriorate.
The daily chart carries more weight because it covers a broader period of trading and filters out more short-term volatility. The four-hour chart can identify an early rebound, but the higher timeframe provides stronger confirmation of whether the wider trend has changed.
A recovery above $84 would strengthen the rebound, while a break below $78 on the daily chart would signal that the larger correction is gaining control.
HYPE now sits between conflicting signals: bearish divergence on the daily chart and a possible continuation setup on the four-hour timeframe. Defending the $78–$80 support zone and reclaiming $84 would keep another test of the record in play. A daily close below $78 would instead shift attention toward a deeper retracement near $73.
The article is for informational purposes only and does not constitute financial or investment advice. Cryptocurrency markets are highly volatile. Always conduct your own research and assess your risk tolerance before making investment decisions.
The post HYPE Price Pulls Back as Rate-Hike Bets Surge appeared first on Coindoo.