Older Bitcoin, consisting of coins that had remained dormant for extended periods, has recently started moving on Binance. This distribution activity pushed CryptoQuant’s Supply-Adjusted Coinday Destroyed (CDD) metric to roughly 533.4, with its 7-day average hitting approximately 1,130.
The total US dollar value of these coins reached approximately $350 million. While this recent activity is elevated, it remains below the 30-day average of $516 million, indicating that the current movement is controlled rather than a capitulation event. This on-chain shift is occurring while Bitcoin was trading near the $61,980 level.
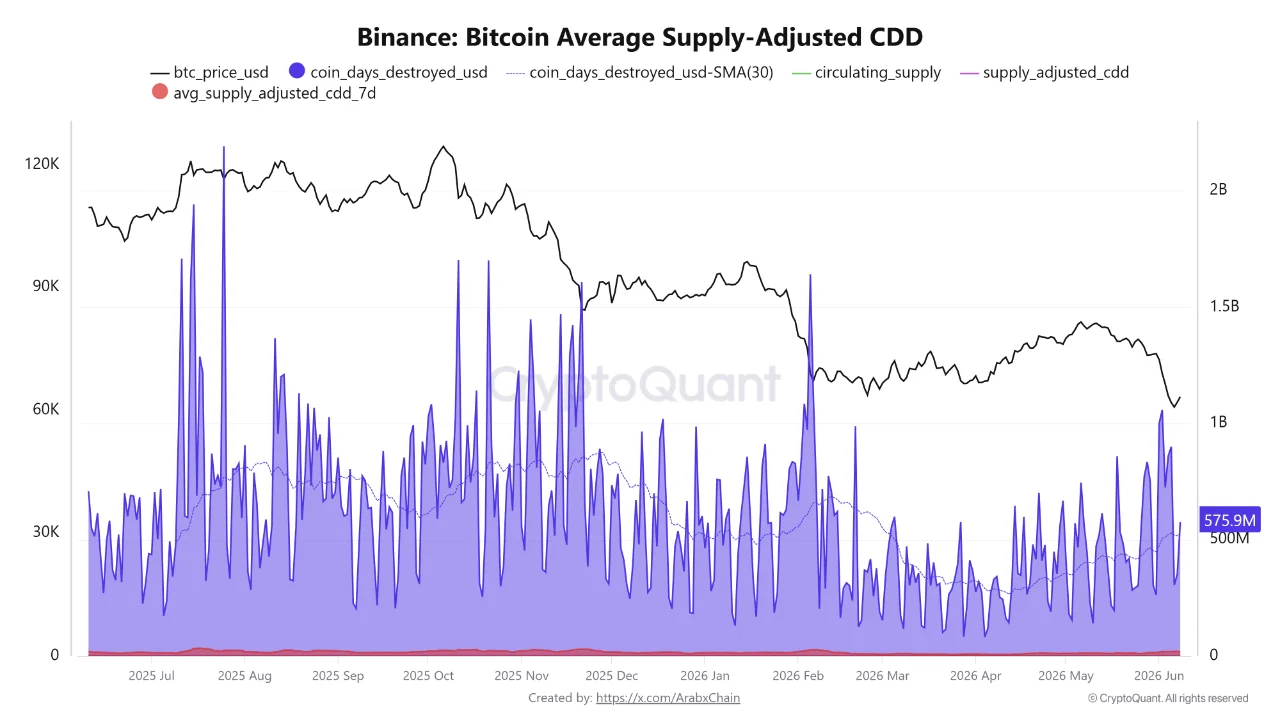
Historical patterns confirm that CDD spikes typically cluster around major market inflection points. This was visible around the $120,000 cycle peak in October 2025, and the current late-May to early-June uptick directly coincides with the latest price leg down toward the $60,000 threshold.
A rising CDD metric is not an inherently bearish signal. Instead, it flags that previously illiquid supply is becoming active, an event that historically precedes heightened market volatility. When evaluated alongside broader ecosystem data, such as the 475,000 ETH exchange drain and a derivatives reset across XRP and ETH, the movement fits a broader picture of large-scale holders shifting capital allocations across the crypto market.
While older market participants are moving supply, aggregated ETF data provides clear evidence of who is absorbing these coins. Since the launch of spot Bitcoin ETFs in early 2024, total institutional holdings have grown from roughly 633,000 BTC to 1.3739 million BTC as of June 2026. This represents a more than 100 percent increase in institutional exposure over a 29-month period.
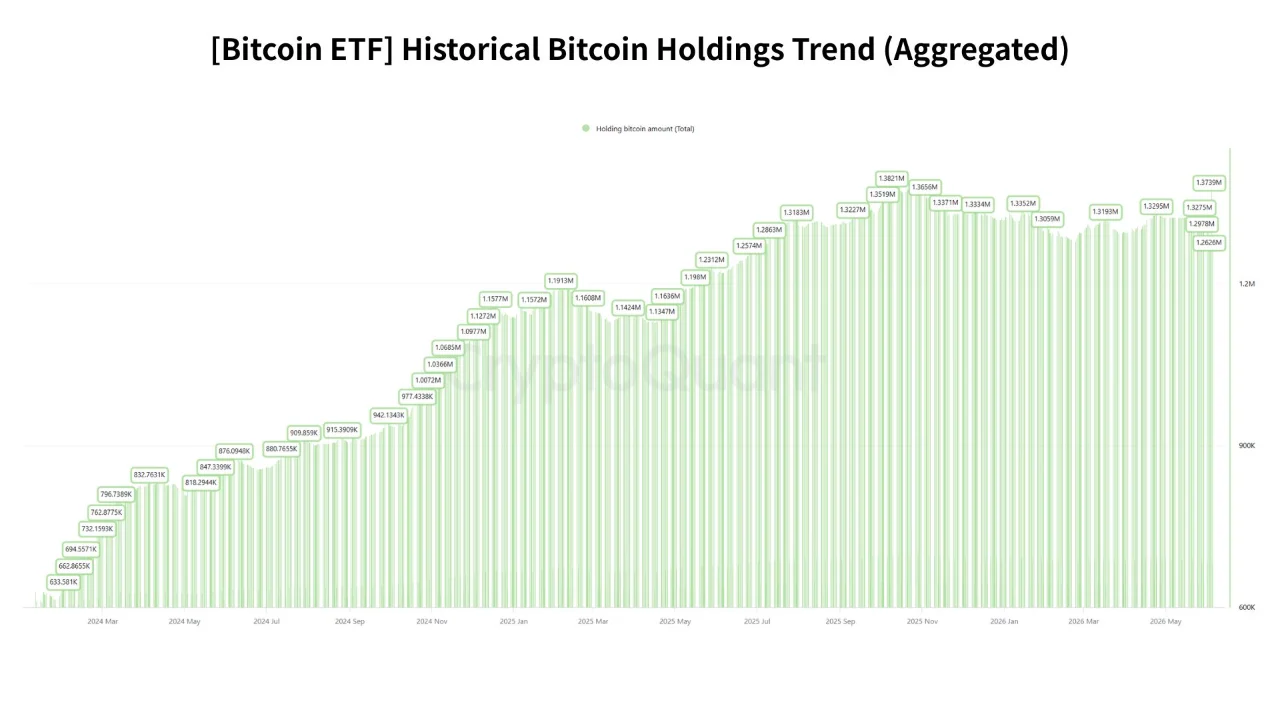
This accumulation trend developed in distinct phases. Growth accelerated sharply through late 2024, peaked near 1.3821 million BTC around mid-2025, pulled back modestly to the 1.29 million to 1.30 million range, and has since recovered to its current near-peak levels.
To evaluate the strength of this institutional floor, market participants must distinguish between the three primary categories driving these inflows:
The consistent upward trajectory of aggregated ETF holdings, interrupted but never reversed by short-term price drops, reflects a compounding effect among these three investor classes.
From an analytical perspective, a $500 million hedge fund rotation and a $500 million pension allocation appear identical on an inflow chart. However, their long-term market impact is entirely different. While tactical traders rotate capital based on short-term price fluctuations, slow-moving institutional allocators are executing multi-year accumulation strategies.
The data indicates that the older Bitcoin currently entering the market is not driving a systemic downturn. During the same period, aggregated ETF holdings have continued expanding, suggesting that long-term institutional buyers have been absorbing available supply – though a direct causal link between the two movements requires additional exchange flow data to confirm.
This market analysis is compiled strictly for informational and research purposes based on observable blockchain and derivatives exchange data feed structures. It does not constitute investment advice, financial promotion, or an endorsement to buy, sell, or hold any digital assets.
The post 1.37M+ BTC in ETFs: Who Is Buying the Supply appeared first on Coindoo.