The timing adds another layer to the setup. Pi Network’s new upgrade is expected today – July 22, creating a potential catalyst while the token remains more than 90% below its all-time high. The upgrade alone does not confirm a price move, but it arrives as Pi sits between clearly defined support and resistance levels.
The latest bounce began inside the $0.070–$0.072 capitulation zone, where record-volume selling was absorbed and the lows held on an immediate retest. That pattern produced a measured target near $0.10, which was effectively completed when Pi reached $0.1035.
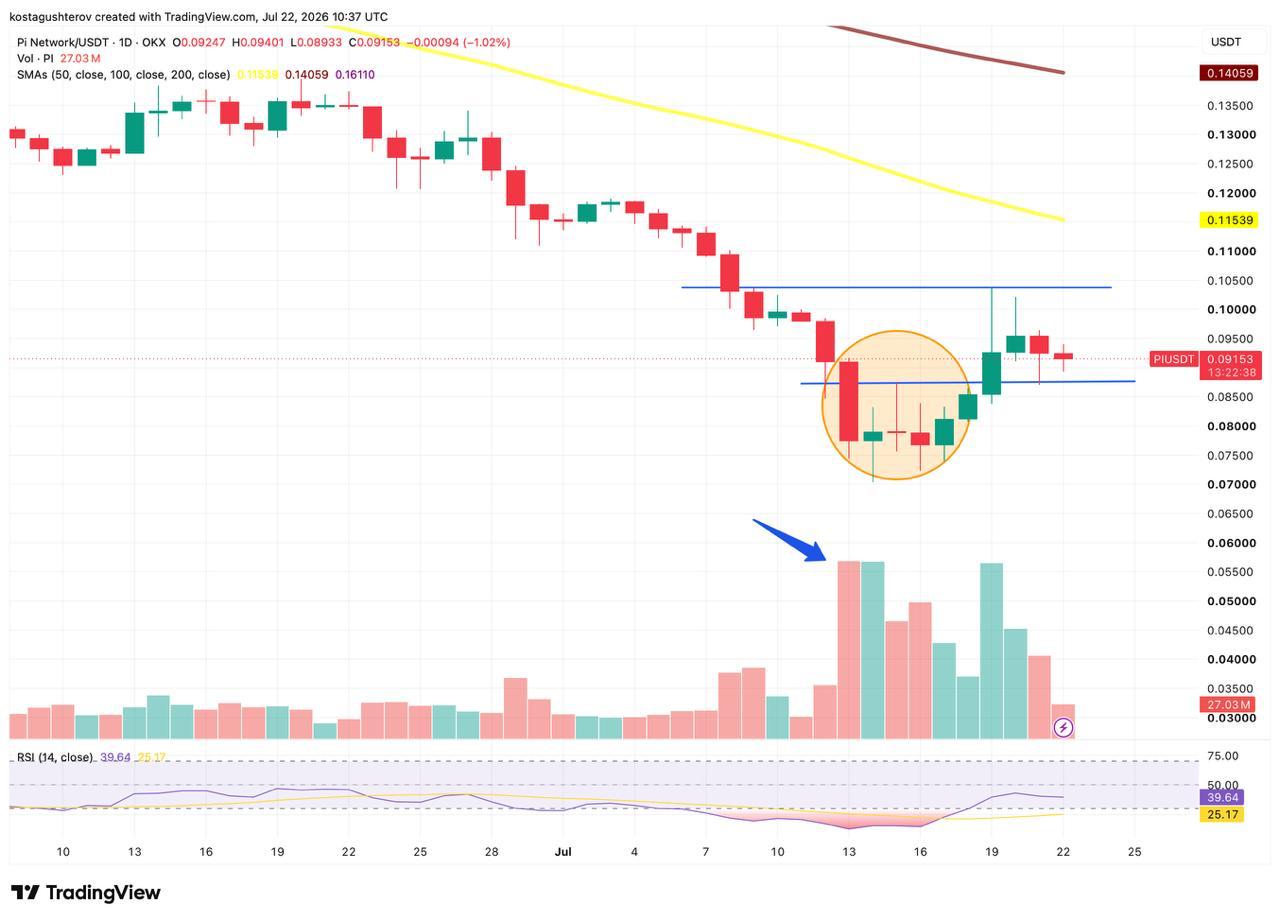
This matters because the first objective of the rebound has already been achieved. Price is no longer trading at the beginning of the pattern, where the potential reward was still largely ahead. It is now consolidating after reaching the projected target, meaning further upside requires a new source of momentum.
The current pullback has returned Pi toward $0.087, a level that previously acted as resistance before the move toward $0.1035. Holding it would preserve the retest and keep the short-term recovery structure intact.
The expected upgrade could provide the event needed to increase market activity, but the chart still determines whether that attention translates into a sustainable move. Pi remains trapped below the $0.100 to $0.103 rejection zone, where the previous advance lost momentum.
A reaction to the upgrade would therefore need to do more than produce another brief intraday spike. Price would have to maintain support above $0.087, return through $0.100 and challenge the recent $0.1035 high with stronger volume.
Without that confirmation, the upgrade may generate attention without changing the existing structure. Pi is still trading inside a steep broader downtrend, and the latest recovery is only several days old.
As long as $0.087 holds, Pi retains a path back toward the $0.100 to $0.103 resistance area. A decisive move through that zone could extend the recovery toward $0.11.
The falling 50-day simple moving average at approximately $0.115 would then become the first major resistance above the recent high. Reaching that level would require Pi to move beyond the completed target and establish a new phase of the recovery.
The relative strength index is near 40, leaving room for momentum to improve before reaching overbought territory. However, the available space on the indicator does not guarantee continuation. Because the original pattern target has already been filled, fresh buying volume would be needed to support another push higher.
A daily close below $0.087 would weaken the retest and invalidate the immediate recovery structure. Under that scenario, the first downside level would sit near $0.08.
Continued selling could then return Pi toward the $0.072 to $0.070 capitulation zone where the latest rebound began. That area represents the final visible support protecting the token from another continuation of its primary downtrend.
A daily close below $0.070 would invalidate the base built at the capitulation lows and push Pi into price discovery beneath its all-time low, with no historical support left to reference. The July rebound would then read as a temporary relief move rather than the start of a durable bottom.
Despite the rebound from $0.070, Pi remains below its 50-day, 100-day and 200-day simple moving averages. The averages are all positioned above the current price, reinforcing that the dominant trend remains bearish.
The 50-day average near $0.1154 is the closest of the three, followed by the 100-day near $0.1406 and the 200-day around $0.1611. That separation shows how much resistance remains above the short-term structure.
This article is provided for informational purposes only and does not constitute financial, investment or legal advice.
The post Pi Coin Shows Signs of Life Ahead of a Key Upgrade appeared first on Coindoo.