TradingView’s ZEC/USD daily chart on Coinbase showed Zcash trading near $1,165, up 13.8% for the session, on September 6 at 12:50 UTC. ZEC opened at $1,025 and traded between a low of $1,023 and a high of $1,220, producing an intraday range of approximately 19%.
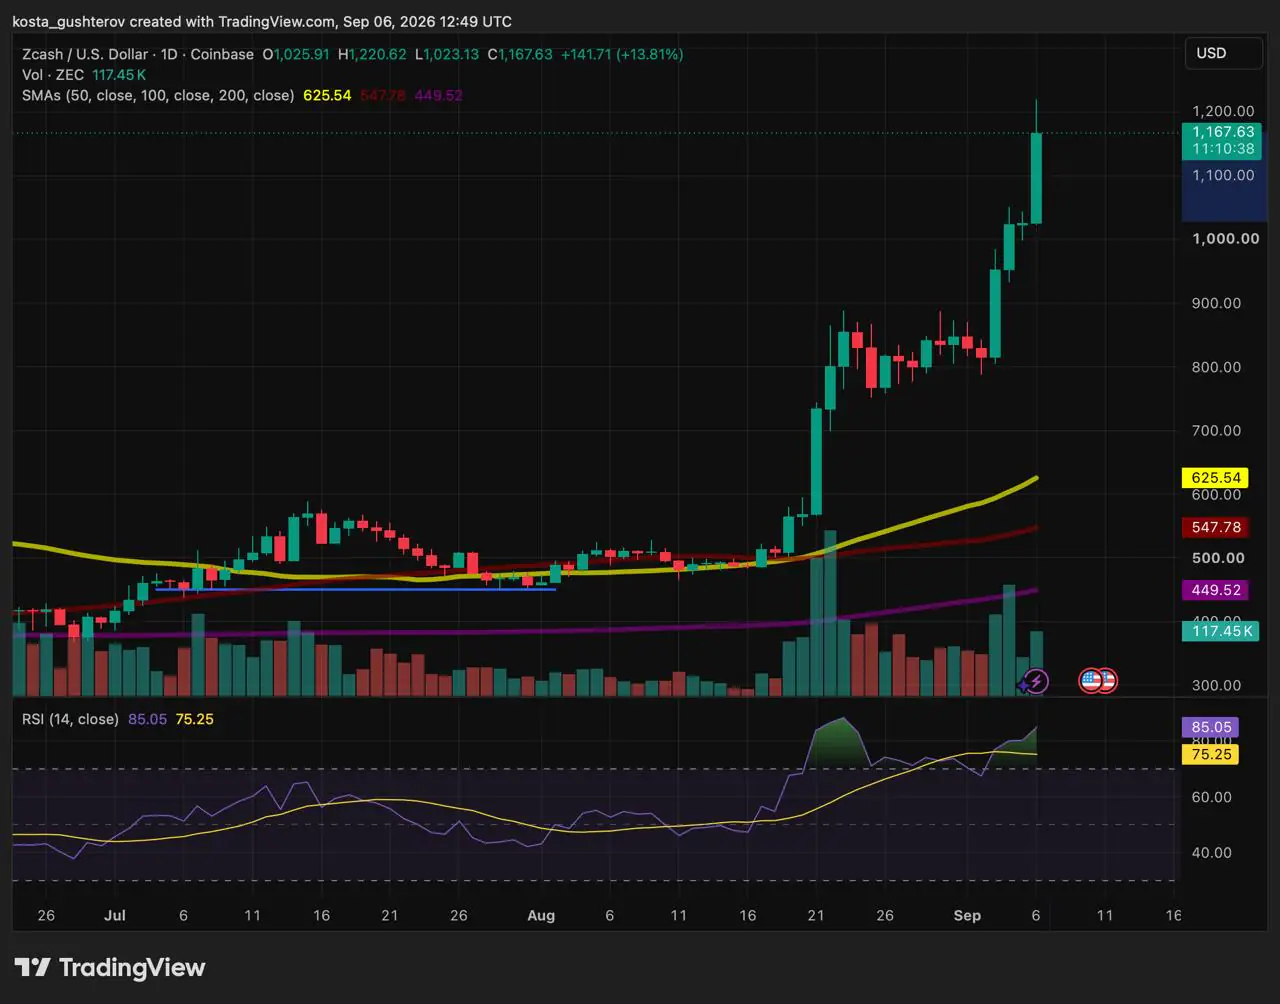
Price had retreated about 4.3% from the high by the time of capture, showing that it met selling pressure above $1,200. Because the daily candle remained open, neither the rejection near $1,220 nor the breakout above $1,200 had been confirmed at the close.
The latest move follows the approximately 16% advance recorded on September 3. At that point, ZEC was still approaching resistance near $952 and the psychological $1,000 threshold, as examined in an earlier analysis of the Zcash rally. Both levels have since been cleared.
The session’s high places immediate resistance between $1,200 and $1,220. An intraday move through that area can reverse before the daily close; finishing the session above it followed by successful retest would show that demand persisted throughout the day.
The displayed three-month chart provides no recent resistance above $1,220, so it does not support a precise next target. The more useful references are the levels beneath the current price.
Zcash levels after the breakout
$1,200-$1,220
Immediate resistance created by the latest intraday high.
$1,025-$1,000
The first support area, covering the daily opening range and former resistance.
$950-$930
The previous breakout stage if ZEC fails to remain above $1,000.
$850-$800
The deeper base formed during the consolidation before the latest advance.
At $1,165, ZEC stood approximately 87% above its 50-day simple moving average of $625. The 100- and 200-day averages were even lower, near $547 and $449.
Those averages describe the longer trend but sit too far below the market to identify near-term support. The recently traded zones between $930 and $1,025 provide more relevant information about where buyers previously entered.
The rally developed during a weekend before the U.S. Labor Day holiday. The NYSE calendar shows that American stock markets will remain closed on Monday, September 7.
Crypto will continue trading, but U.S. equities and exchange-traded crypto products will not provide their usual cross-market signals until Tuesday. That session will show whether ZEC preserves its relative strength when U.S. cash-market trading resumes.
Bitcoin’s direction also remains relevant. Holding above $1,000 during a broader crypto pullback would strengthen ZEC’s performance relative to the market. A simultaneous decline below $1,000 would show that ZEC had not withstood a market-wide retreat.
The Bureau of Labor Statistics calendar schedules the August Producer Price Index for September 10 and the Consumer Price Index for September 11. CPI will be the final major consumer-inflation reading before the Federal Reserve meets on September 15-16.
A hotter reading could raise market-implied rate expectations and Treasury yields, conditions that can reduce demand for speculative assets. A recent example followed the stronger-than-expected U.S. jobs report, when Bitcoin fell below $80,000 and Ethereum slipped under $2,500 as markets reassessed the likelihood of tighter Federal Reserve policy.
That reaction shows how a macroeconomic surprise can interrupt a crypto advance, although it does not mean CPI will produce the same result. Softer inflation could ease pressure on yields and rate expectations, while another upside surprise could weigh on the broader market as Zcash attempts to establish support above $1,000.
The Federal Reserve calendar marks the September meeting as one accompanied by updated economic projections. Markets will therefore receive both a policy decision and policymakers’ revised forecasts for growth, inflation, unemployment and interest rates.
At the time of writing, CoinGlass showed approximately $7.68 billion in 24-hour ZEC futures volume and about $755 million in spot volume. Futures turnover was roughly 10 times larger than spot activity.
Open interest stood near $2.73 billion, compared with the $2.15 billion recorded in the September 4 analysis when ZEC was still approaching $1,000. That represents an increase of roughly 25%, although CoinGlass uses live and rolling data, so the difference should not be interpreted as an exact two-day inflow.
The combination of approximately $2.78 billion in open interest and futures turnover more than ten times spot volume increases the importance of monitoring liquidations. It does not predict the next move, but it shows that leveraged markets remain much more active than the underlying spot market.
A daily close above $1,200 would show that ZEC held beyond the resistance encountered near its intraday high. A fall below $1,000 would instead weaken the breakout and return attention to $950-$930. Until the session ends, the $1,220 high remains provisional.
The article is provided for informational purposes only and does not constitute investment advice.
The post Zcash Price Jumps Another 13% – What Could Disrupt the Rally? appeared first on Coindoo.