ARB traded near $0.165 on the Coinbase daily chart on September 7 at around 09:50 UTC, after rising from an early-August area around $0.078. The advance reached $0.206 before reversing, leaving the token about 19.6% below its recent high at the time of the chart capture.
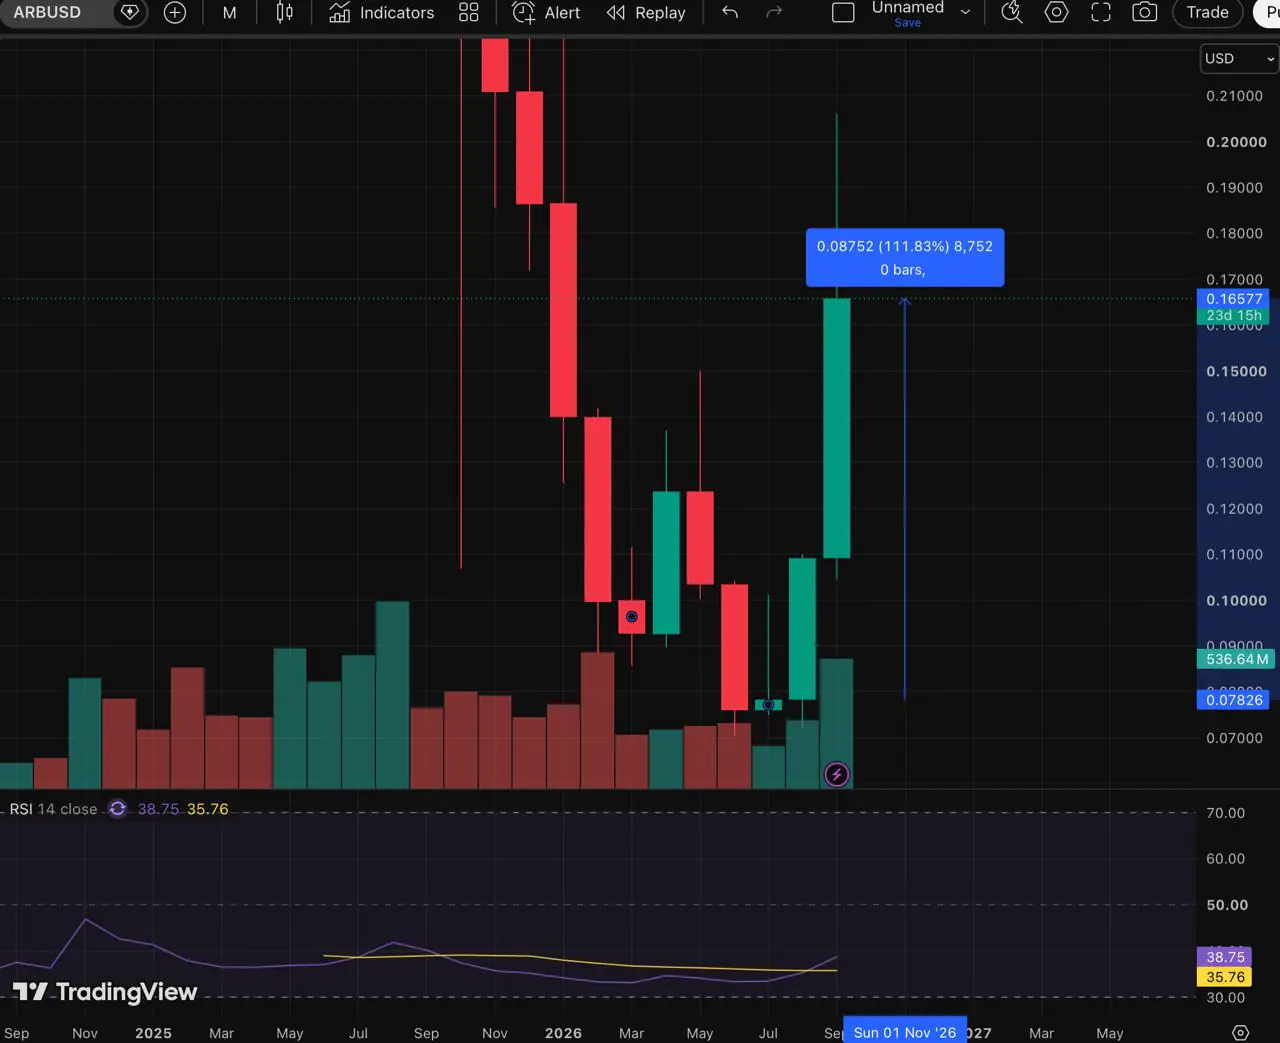
CoinGecko data showed ARB up about 90% over seven days, while total crypto market capitalization had gained about 2.4% over the same period. That performance gap suggests traders were also responding to Arbitrum-specific developments.
One important factor is the commercial structure behind Robinhood Chain. The network launched on public mainnet on July 1 as a dedicated Arbitrum chain that settles to Ethereum. Under the Arbitrum Expansion Program, 10% of its protocol net revenue is allocated to the ecosystem: 8% to the ArbitrumDAO treasury and 2% to the Arbitrum Developer Guild.
The distinction between net revenue and gross transaction fees matters. Not every fee paid by a Robinhood Chain user becomes DAO income. Still, the agreement gives ArbitrumDAO a measurable economic interest in the chain’s activity. ArbitrumDAO’s Robinhood Chain factsheet says the treasury share is routed through the AEP fee router and included in regular DAO financial reporting.
Robinhood’s stock-token products, lending services and liquidity applications operate on that infrastructure. This earlier look at how Robinhood Chain’s transactions connect to Arbitrum explains why the relationship matters beyond a standard technology partnership.
In a late-August update, the Arbitrum Foundation said Robinhood Chain had generated more than $800,000 in revenue over the preceding seven days. The figure showed that the arrangement was already producing activity worth monitoring, although a one-week run rate cannot establish long-term income. The Foundation’s update annualized that pace at roughly $42 million.
Robinhood Chain can strengthen the DAO treasury, but ARB does not currently give holders an automatic right to that revenue. There is no built-in buyback, dividend or distribution mechanism tied to the AEP payments.
A larger treasury can fund ecosystem spending, but only through future DAO decisions. It can support grants, security work, liquidity programs and product development, while making governance over those assets more consequential. The rally can therefore be read as a bet on ecosystem growth and governance value, rather than a direct revenue-yield trade.
That is also the key risk in the current narrative. Sustained Robinhood Chain revenue would improve the DAO’s position, but the market will eventually need to see how that income is used if it is to support a higher long-term valuation for ARB.
The Arbitrum Foundation’s first-half 2026 report, published on September 2, showed that the DAO already had several income sources beyond the Robinhood arrangement. It reported $6.19 million in total first-half income from transaction fees, Timeboost, Arbitrum Expansion Program licence fees and treasury income, with gross margins of 97% across those revenue streams.
The report also listed $125 million in non-ARB treasury assets as of June 30. Arbitrum processed 478 million transactions during the first half of the year and averaged more than $70 billion in monthly stablecoin transfer volume, according to the Foundation’s progress update.
These figures do not show that the report caused ARB’s rally but they show that the DAO’s income is diversified and that Robinhood Chain is joining an ecosystem with an established activity base.
RWA.xyz lists $972.96 million in distributed asset value and $24.55 million in represented asset value on Arbitrum. The platform recorded 9,706 RWA holders and $398.58 million in 30-day transfer volume.
Its 4,678 listed tokenized assets show the breadth of Arbitrum’s RWA footprint, but issuance does not automatically mean those assets trade actively. Many tokenized funds, debt instruments and securities are designed for long-term holding, restricted to eligible investors or traded through limited venues. The better evidence of growing use will be continued increases in holders, transfers and fee-paying activity.
RWA dashboards also use different methodologies. DeFiLlama puts Arbitrum’s active RWA market capitalization at $822.92 million, below RWA.xyz’s broader distributed and represented asset values. The difference is a reminder that tokenized-asset totals should be read as indicators of network scale, not as a single definitive measure of liquidity.
DeFiLlama also puts Arbitrum’s DeFi TVL at about $1.42 billion, alongside $3.59 billion in stablecoin market capitalization, $118.8 million in daily DEX volume and $734.8 million in daily perpetuals volume. Stablecoin totals can vary across dashboards because providers classify bridged, represented and native assets differently.
The latest data from growthepie shows 1.3 million transactions and 87,700 daily active addresses on Arbitrum. Those figures show that the network has an active user base, but they cannot determine how much of that activity came from Robinhood Chain, RWAs or other applications.
Arbitrum’s recent technical work also fits the institutional-use narrative. ArbOS Elara, activated on August 20, added larger contract-size limits and programmable compliance controls for dedicated chains, alongside changes to fee and data-availability infrastructure. The Foundation has also outlined research into using zero-knowledge proofs to speed up settlement while retaining optimistic-rollup safeguards. Arbitrum’s August update described both developments.
Neither development proves a direct cause of the latest ARB move. They do help explain why a financial firm or tokenization issuer may view Arbitrum as infrastructure for a dedicated, regulated or high-volume product.
That fundamental backdrop explains why the breakout attracted attention. The chart now shows whether buyers are prepared to defend it.
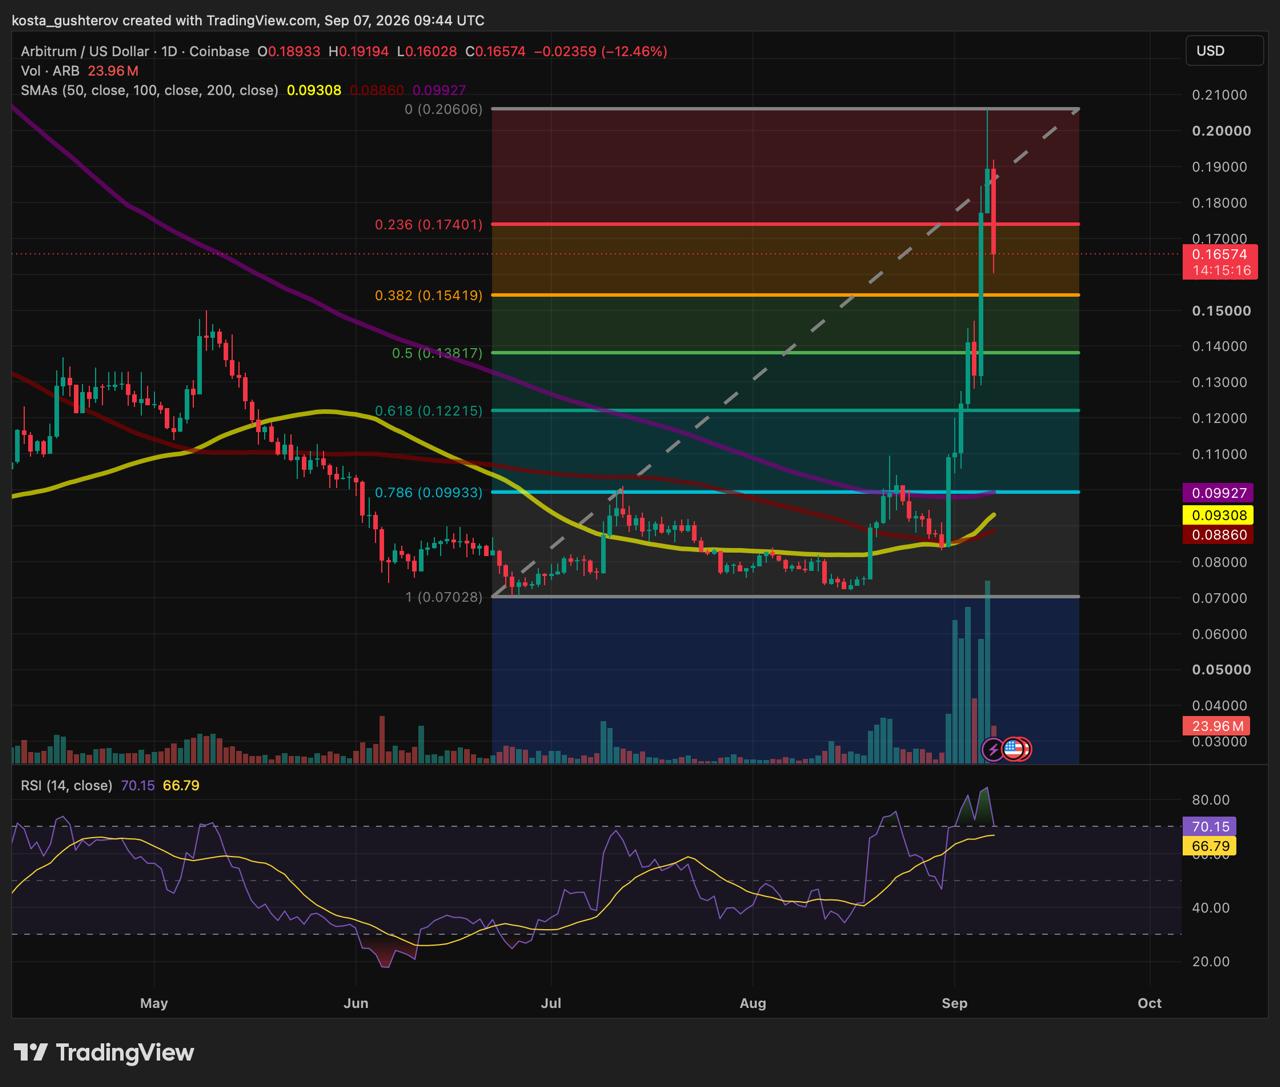
The Fibonacci retracement is drawn from the $0.07028 swing low in July to the $0.20606 September rally high visible on the daily chart. ARB slipped below the 23.6% retracement at $0.17401, turning it into the first level buyers need to reclaim.
ARB price levels to watch
Key Fibonacci resistance and support zones
A daily close above $0.174 would show that buyers have recovered the first lost Fibonacci level. That would reopen the path toward $0.191 and then $0.206. If daily closes hold above $0.15419 but remain below $0.174, ARB would be consolidating after the rapid advance rather than confirming a new leg higher.
A close below $0.154 would put $0.138 in view, followed by $0.122. A deeper decline would bring the $0.099 retracement into focus. That area sits near the 200-day moving average at $0.09927; the 50- and 100-day averages are lower, near $0.093 and $0.088.
The chart showed volume rising during the breakout. Whether volume returns on a reclaim of $0.174, or grows on a break below $0.154, will help show which side has control after the first major pullback.
The rally coincided with a new DAO-income channel and stronger evidence of Arbitrum’s financial activity. The next evidence traders need is recurring revenue, not another headline.
Robinhood Chain’s reported net revenue should continue to appear in DAO financials, while RWA holders, transfer volume and broader network activity should keep growing alongside asset values. On the chart, ARB needs to hold $0.15419 and reclaim $0.17401 to show that the current move is becoming a defended trend rather than a short-lived repricing of future potential.
This article is for informational purposes only and does not constitute financial advice.
The post Arbitrum Price Jumps 111%: Why Traders Are Repricing ARB appeared first on Coindoo.





