Solana (SOL) maintains a price of $75.55 as of Monday, registering a modest 0.20% gain over the last 24-hour period. The cryptocurrency’s market capitalization stands at approximately $44.03 billion, while daily trading activity hovers around $629 million.
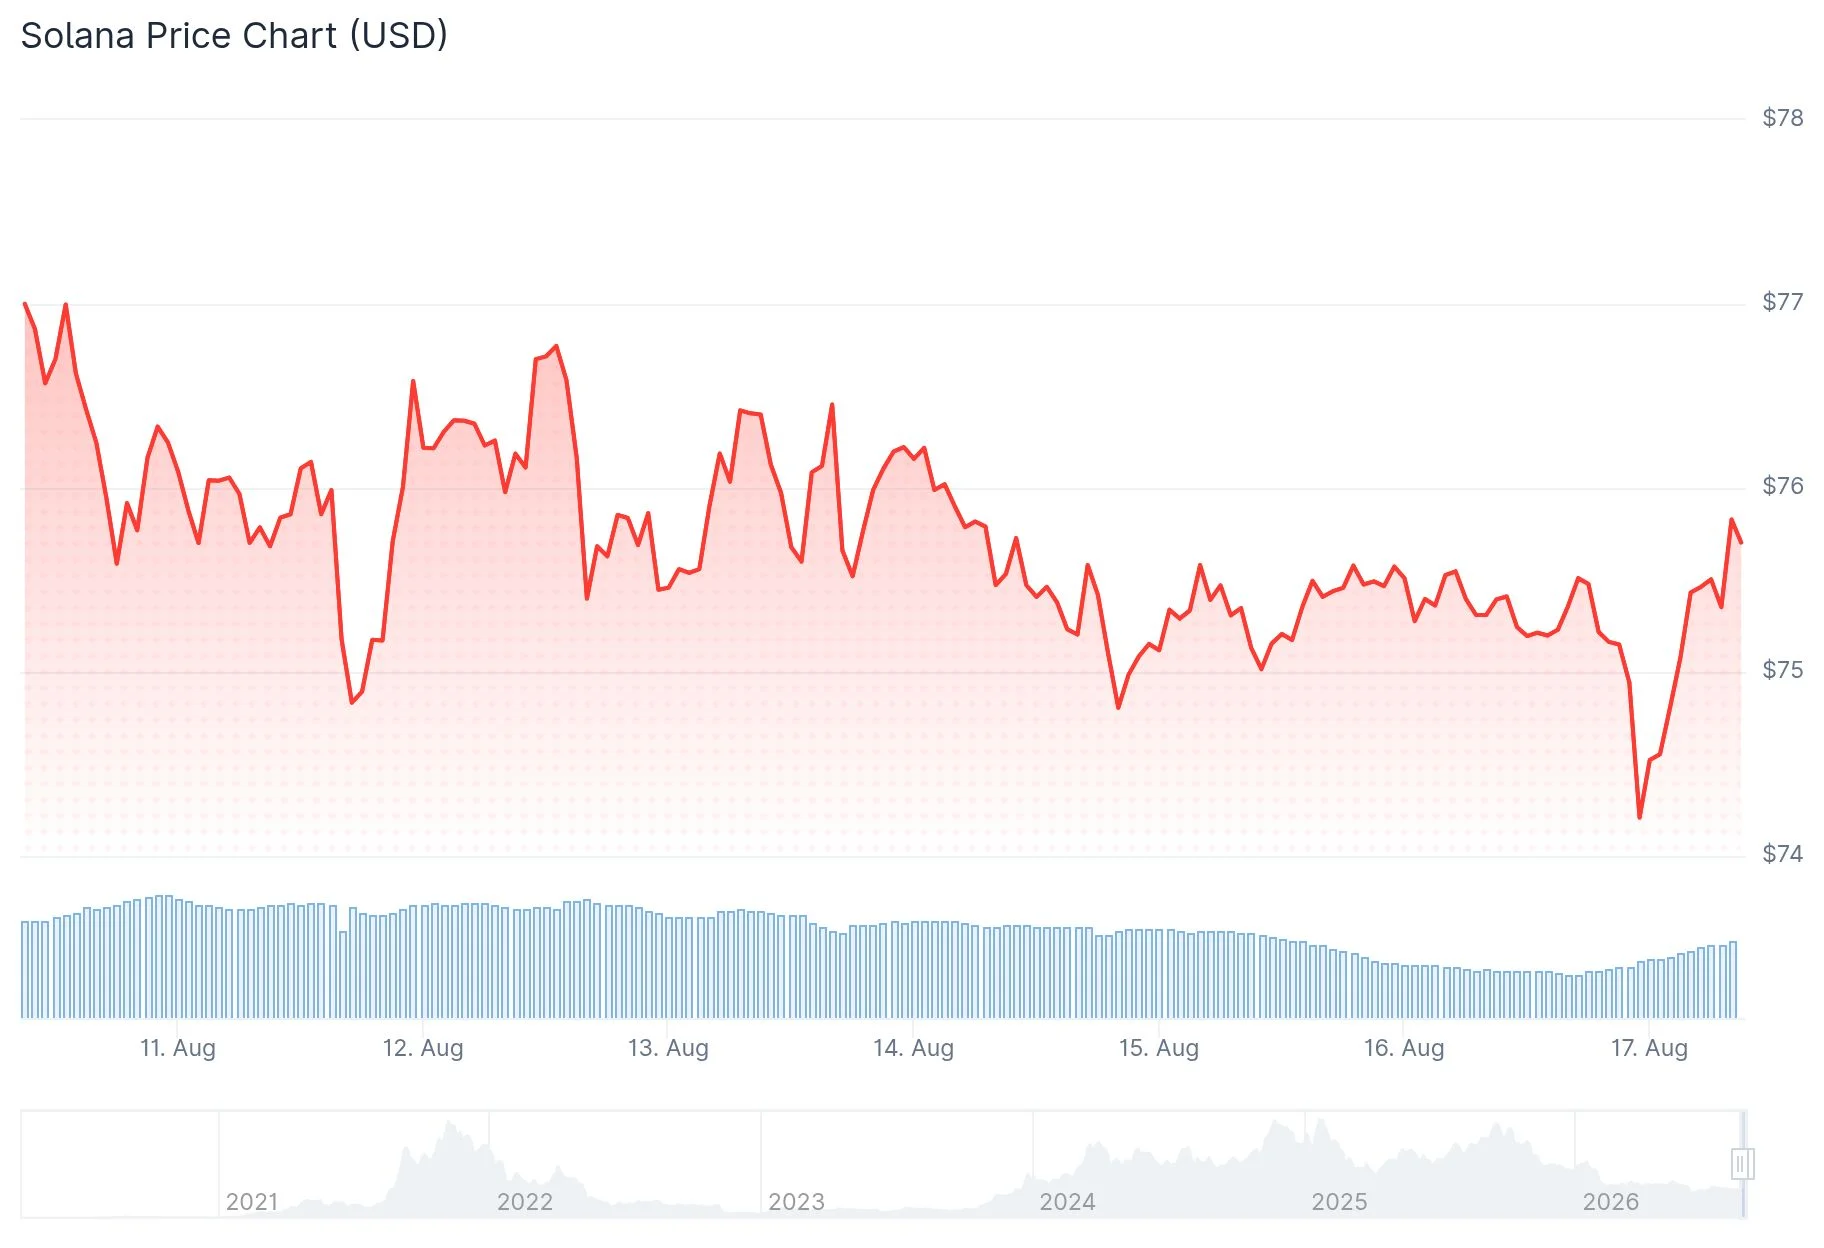
Despite a 2.18% decline over the previous week, SOL discovered buying interest at an upward-sloping trendline. The token currently consolidates within the $73-$75 range, a zone market observers consider pivotal for near-term direction.
Institutional capital continues flowing into Solana-linked products. According to SoSoValue metrics, spot ETF vehicles attracted $10.26 million in fresh capital last week. This represents the seventh uninterrupted week of net positive inflows and registers as the strongest weekly performance since May 22.
CryptoQuant analytics reveal a moderately constructive picture. Substantial whale accumulation appears in spot trading venues, while derivatives markets display reduced activity. Additional indicators maintain neutral positioning.
From a technical perspective, SOL maintains support just above its 50-day exponential moving average positioned at $75.48. The price remains beneath both the 100-day EMA at $78.10 and the 200-day EMA at $88.69.
The Relative Strength Index registers approximately 52, indicating balanced momentum. The MACD indicator holds within positive territory, reflecting price stabilization without clear directional conviction.
Market analyst Alex Marzell highlights that Solana has encountered repeated rejections within the $78-$80 price corridor. Previous attempts to breach this level resulted in pullbacks, establishing this zone as the immediate challenge for bullish participants.
$SOL IS GETTING REJECTED AGAIN.
This resistance has already been tested multiple times, and SOL is now facing rejection #2.
The first rejection sent price lower.
If this one confirms as well, $60–61 becomes the next major demand zone.
SOL needs to reclaim $78–80 to… pic.twitter.com/7hmW9lJItq
— Alex Marzell (@MarzellCrypto) August 15, 2026
Should downward pressure intensify and SOL surrenders the $73 threshold, Marzell projects the $60-$61 region as the subsequent significant support destination.
Analyst Astekz characterizes recent price behavior as erratic yet structurally constructive. SOL appears to be escaping a downward-sloping channel while defending its horizontal support foundation.
Analyst Eliz observes that SOL maintains positioning above the Ichimoku Cloud indicator on the 4-hour timeframe, reinforcing the ongoing consolidation above the $73-$75 breakout threshold.
Analyst ray has detected a symmetrical triangle formation developing on the Solana chart. A validated breakout from this technical pattern suggests a potential advance toward $113, with $100 representing the initial psychological milestone.
Cryptocurrency analyst KillaXBT communicated via X that following Bitcoin’s eventual bottom formation, a 100–150% rally for SOL becomes “absolutely in play,” while acknowledging uncertainty regarding new all-time peak achievement.
Looking further ahead, analyst Sweep forecasts SOL reaching approximately $200 by 2027. This projection incorporates anticipated regulatory framework development, expansion in real-world asset tokenization, stablecoin ecosystem growth, and sustained memecoin activity within the Solana network.
The chart analysis from Sweep pinpoints $179 as an intermediate Fibonacci extension before approaching the broader $212 target territory.
With SOL currently positioned at $75.55, market participants maintain focus on the $78-$80 resistance ceiling above and the $73 support floor below as the determining factors for subsequent price movement.
The post Solana (SOL) Price Consolidates Near $75 as ETF Inflows Mark 7th Consecutive Week appeared first on Blockonomi.





