Since Bitcoin reached its all-time high of $126,000 in October 2025, capital flows across the digital asset sector have shifted toward a sustained risk-off posture. The clearest evidence comes from spot market volume data tracked by CryptoQuant.
CryptoQuant analyst IT Tech flagged the deterioration, noting that the cumulative buy/sell volume difference for altcoins excluding Bitcoin and Ethereum reached a five-year extreme in June before falling even lower.
This is a is a technical indicator that tracks the net balance of aggressive buying versus aggressive selling over time. By summing these imbalances, it reveals whether market participants are actively pushing prices up or down, helping to distinguish between genuine trend conviction and hollow price movements.
“Red trendline tells the story: sharp reversal from early 2025 peak, relentless net selling on spot. No bounce. No pause. Just distribution,” IT Tech wrote, adding that the metric has spent “15+ months in, still no floor.”
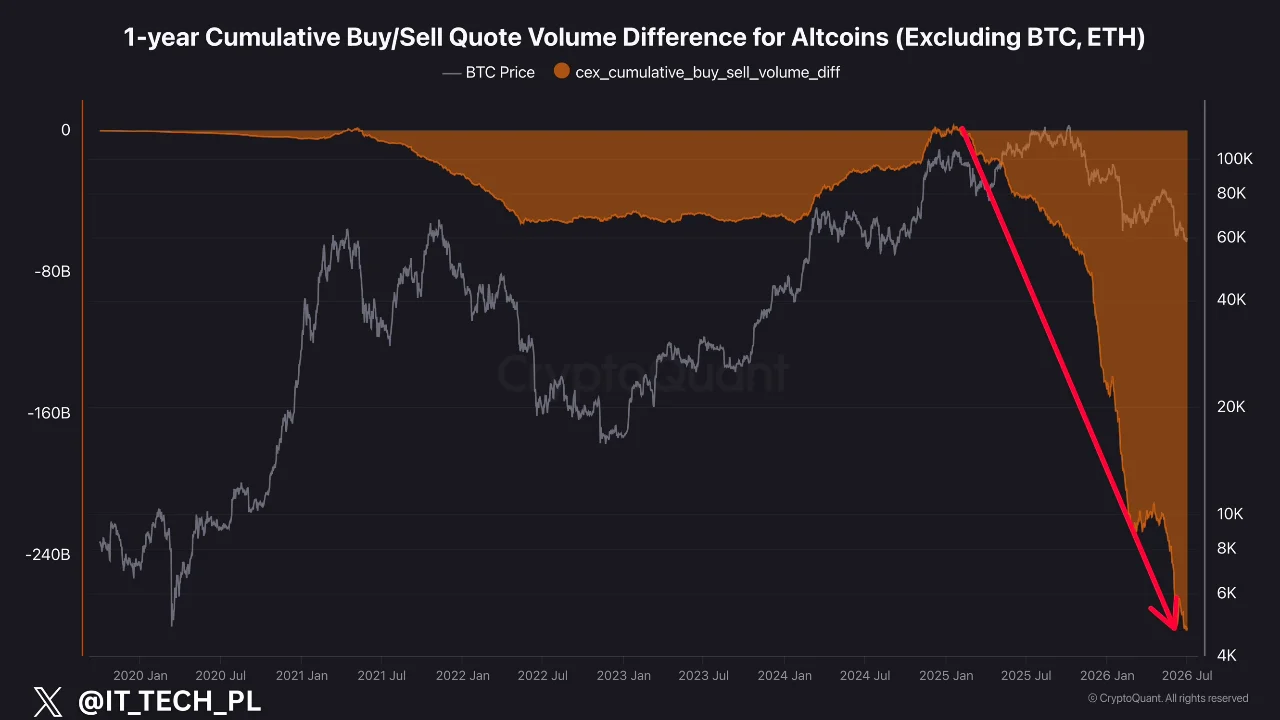
The chart validates a structural distinction from previous corrections. In earlier cycles, periodic dip buying interrupted selling waves and helped establish local bottoms. The current dataset signals uninterrupted net distribution on spot markets since the metric peaked in early 2025.
The current reading is notable relative to prior downturns. During the 2022 bear market, the cumulative volume difference registered sharp declines but printed intermittent recovery phases as dip buyers absorbed supply. The present structure lacks any such interruption, marking the first time in the metric’s five-year history that net distribution has run this long without a counter-move.
Performance across large-cap assets corroborates the volume picture. CoinMarketCap’s 90-day performance data for the top 100 coins, as of July 3, 2026, shows 30 assets in positive territory at the time of writing.
The gainers list is also top-heavy with outliers rather than broad strength. Excluding low-liquidity anomalies, JTO leads major names at roughly 185%, followed by DEXE at 162%, LIT at 115%, and HYPE at 91%. Deeper into the list, returns compress rapidly: UNI sits at 2.4%, SOL at 1.1%, and TRX at 0.6% over the same window, while the remaining majority of large caps hold negative 90-day returns.
| Asset | 90-Day Return |
|---|---|
| JTO | +185% |
| DEXE | +162% |
| LIT | +115% |
| HYPE | +91% |
| UNI | +2.4% |
| SOL | +1.1% |
| TRX | +0.6% |
This distribution suggests liquidity is not rotating broadly across sectors, a pattern typically associated with late-stage distribution rather than early-cycle accumulation.
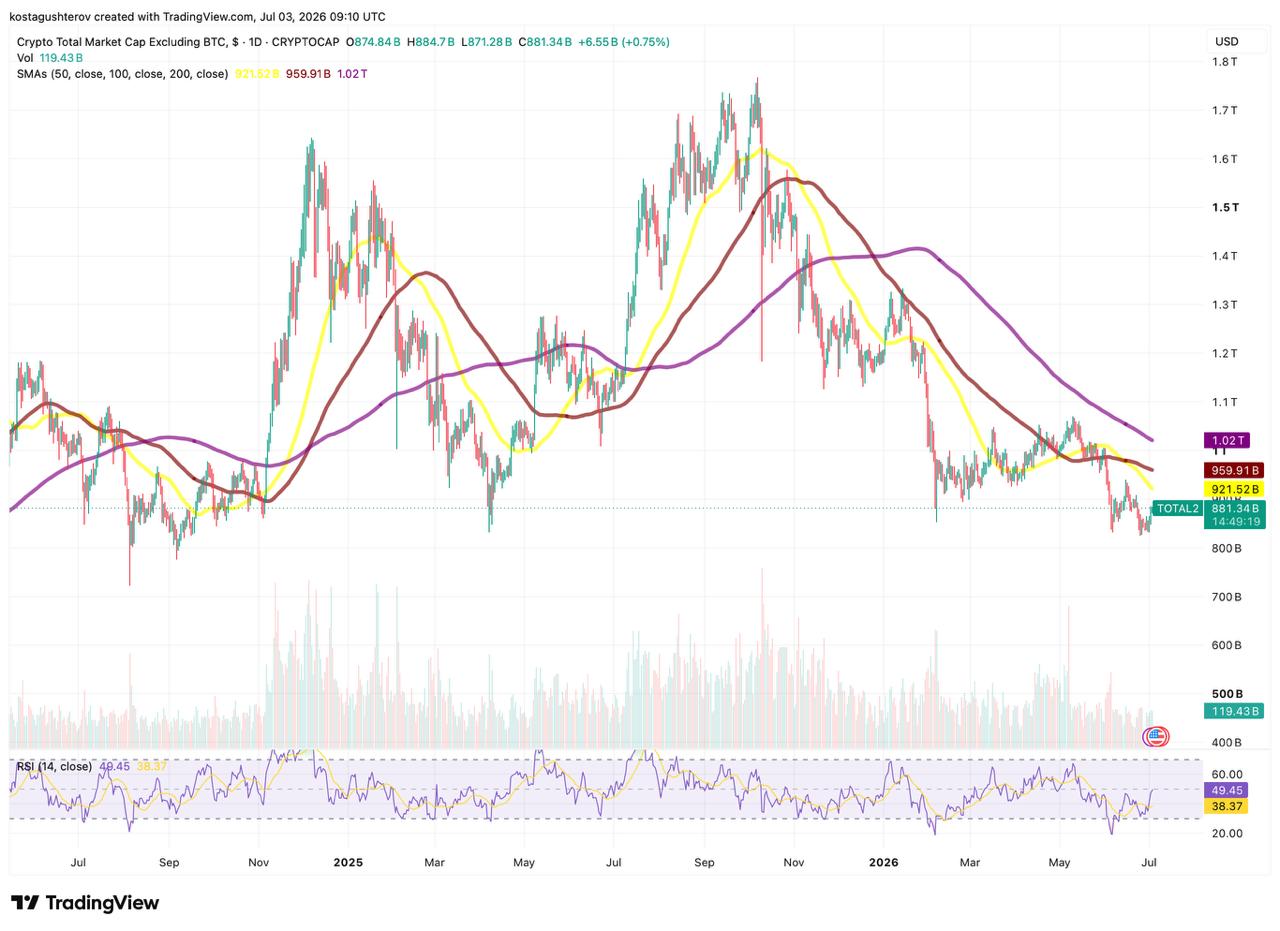
The aggregate picture aligns with the breadth and volume data. TOTAL2, the index tracking crypto market capitalization excluding Bitcoin, is near $881 billion on TradingView as of July 3, down from a cycle peak above $1.7 trillion in late 2025.
The index sits below its 50-day, 100-day, and 200-day simple moving averages, at $921.5 billion, $959.9 billion, and $1.02 trillion respectively, with all three sloping downward. The daily RSI at 49.45 signals neutral momentum rather than the oversold readings that historically preceded durable reversals.
Volume behavior reinforces the picture. Daily turnover on the index sits near $119 billion, well below the levels recorded during the September-October 2025 expansion phase. Declining volume during a drawdown typically signals seller exhaustion in traditional markets, but in crypto it has more often correlated with disengagement, fewer participants on both sides rather than accumulating demand.
The combination of extreme spot selling, narrow breadth, and a TOTAL2 index trading below all major trend markers implies that traditional “altcoin season” expectations may be misaligned with current conditions. Historical rotation patterns assumed that Bitcoin strength would eventually spill into altcoins; 15 months of uninterrupted net distribution challenges that assumption for this cycle.
The pattern also carries implications for Bitcoin dominance, which tends to rise mechanically when altcoin capitalization contracts faster than Bitcoin’s. Prolonged dominance uptrends have historically ended only when a new demand catalyst redirected marginal capital down the risk curve, whether regulatory clarity, a rate-cutting cycle, or a novel market narrative.
Two developments could invalidate the bearish read: a sustained upturn in the cumulative buy/sell volume difference, which would signal absorbing demand returning to spot markets, and TOTAL2 reclaiming its 50-day moving average with expanding breadth among the top 100. Neither is present in the current data. Until either appears, the burden of proof sits with the bulls.
In this environment, asset-specific fundamentals have tended to matter more than broad rotation narratives, a dynamic reflected in the concentration of gains among a handful of outperformers rather than across the market.
The post Altcoin Market Alert: Spot Selling Shows No Floor appeared first on Coindoo.

