Key Takeaways
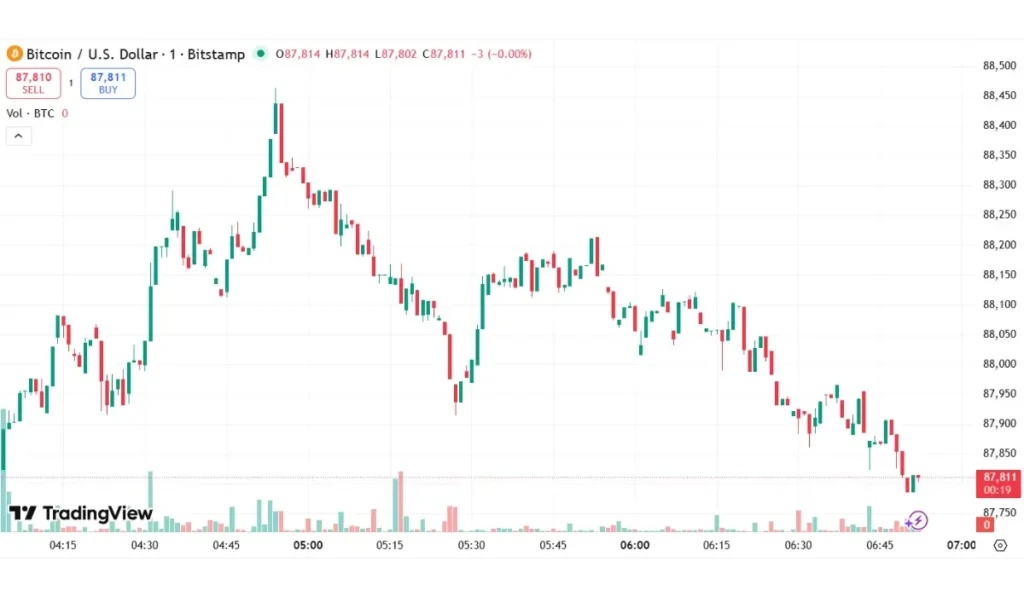
The token is currently trading at around $87,811.19, and the price is slightly up today, with the market cap touching $1.75 trillion.
Even so, the token is trading below the 200-day Simple Moving Average (SMA). The Fear & Greed Index has shown slight improvement from yesterday, but remains deep in ‘Extreme Fear’ territory at 19, reflecting the continued risk aversion across the market. The market sentiment is still bearish with high volatility. The following are the key market indicators and their value.
Bitcoin is currently testing the $88k level. If the token fails to reclaim $88k to $90K level today, a deeper correction to $85k-$84k cannot be ruled out. Otherwise, as for today, Bitcoin is projected to be range-bound within the 88k zone.
As for the upcoming weeks, if the macro pressure and technical breakdown persist, Bitcoin is likely to trade within an average price range of $81k to $87k. Deeper corrections to $78k-$79k are still on the table if the market remains devoid of any ecosystem catalysts or strong macro signals.
| Date | Day of week | Daily Low | Daily High | Average |
|---|---|---|---|---|
| 26/11 | Wednesday | $86,996.01 | $87,172.82 | $87,084.42 |
| 27/11 | Thursday | $84,488.01 | $87,352.60 | $85,920.31 |
| 28/11 | Friday | $78,988.01 | $81,691.54 | $80,339.78 |
| 29/11 | Saturday | $79,812.6 | $81,888.01 | $80,850.31 |
| 30/11 | Sunday | $80,980.17 | $84,395.65 | $82,687.91 |
| 01/12 | Monday | $81,584.6 | $85,496.01 | $83,540.31 |
| 02/12 | Tuesday | $83,785.10 | $84,541.41 | $84,163.26 |
The technical indicators, macro parameters, and institutional activities are the key factors determining the price movements. Here is a detailed look at the crucial factors affecting the price of Bitcoin.
Bitcoin is trading below the 10-day Simple Moving Average (SMA) and Exponential Moving Average (EMA). The MACD histogram suggests a bearish crossover. The 14-day RSI ( Relative Strength Index) has recovered from the oversold territory to reach 32, indicating a cooling selling pressure even if the broader downtrend continues.
Bitcoin Exchange Traded Funds (ETFs) recorded a net inflow of $9.70 million yesterday, November 24. However, the ETF flows turned negative over the past week, with a net outflow of $254.15 million. The numbers indicate dwindling institutional investor interest. The Strategy refraining from its weekly acquisition amid the falling stock prices has further deepened the bearish sentiments.
The Bureau of Labor Statistics (BLS) has cancelled the release of the October Employment Situation, Consumer Price Index (CPI), and Real Earnings data. The Fed has to decide on the rate cuts without up-to-date data. Amid the dearth of data, the looming macro uncertainties are forcing investors to adapt a risk-averse approach.
Bitcoin has fallen over 20% this month, and if the token fails to reclaim $88k to 90k soon, deeper corrections would follow. As for the medium term, the Fed rate cuts remain the most crucial factor in determining the price trajectory. The investors are advised to follow a cautious approach.
Disclaimer: These crypto price forecasts are based on predictive modeling and should not be considered financial advice.
The post Bitcoin Price Prediction Today: Will BTC Successfully Defend $88k-$90k Level? appeared first on BiteMyCoin.

