Price often reacts around specific zones where large participants have previously placed large orders. Two structures used to frame that behaviour are order blocks and breaker blocks. While they’re often mentioned together, they serve different analytical purposes, especially once market structure shifts.
Understanding the order block vs the breaker block distinction adds context to retracements, failed support or resistance, and continuation moves across timeframes. This article examines how each forms, how they’re applied, and how traders analyse them in markets.
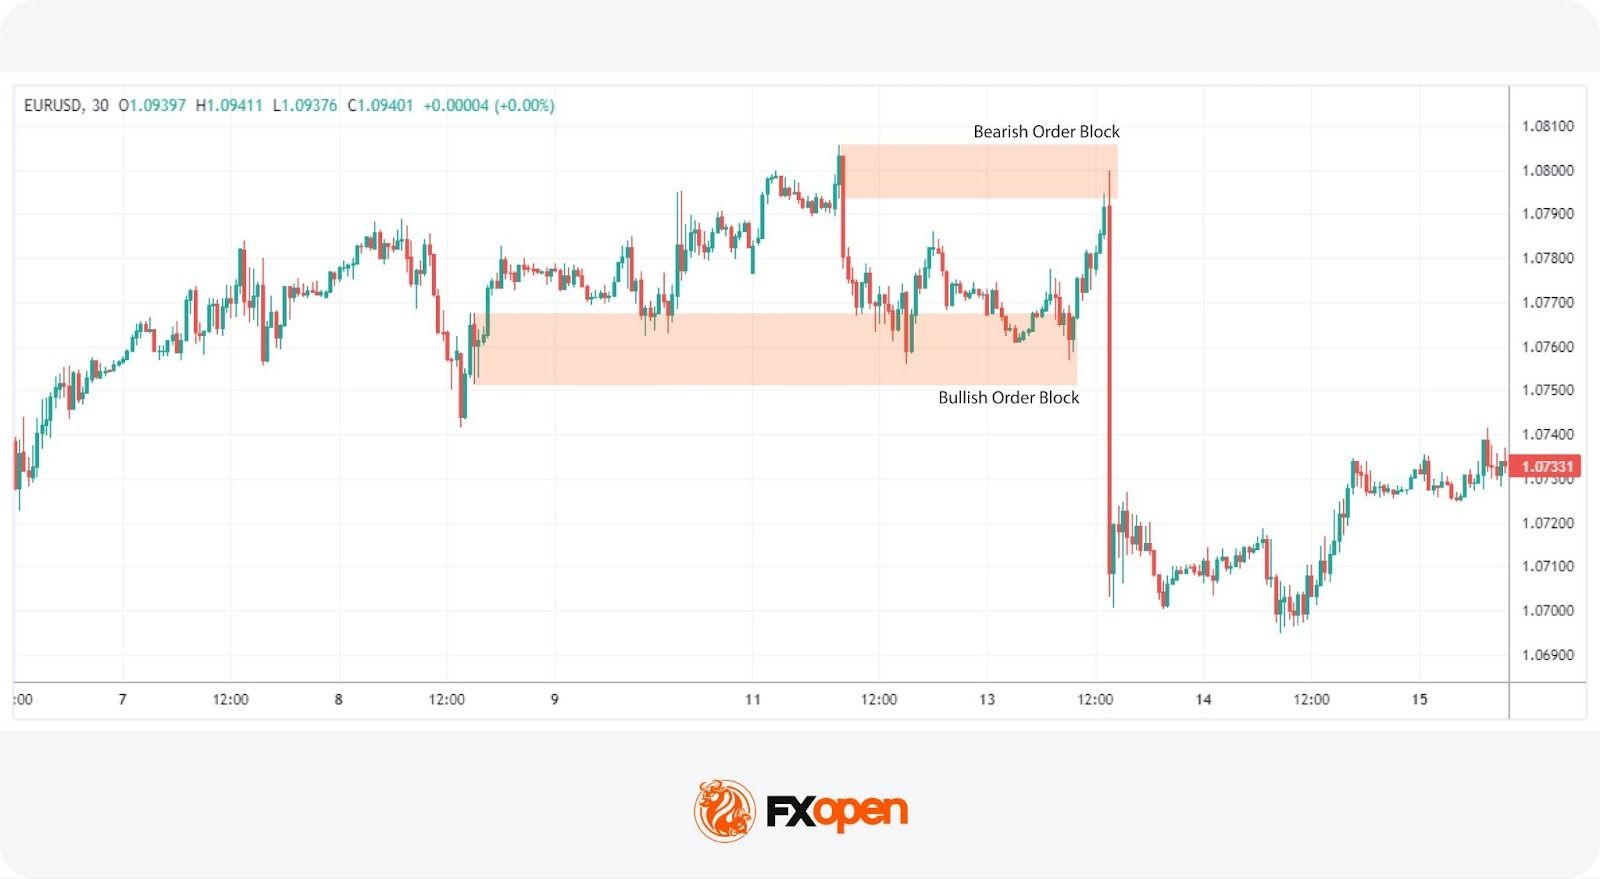
An order block, also known as a supply or demand zone or OB, represents a significant area on the price chart where large market participants, such as banks or institutional traders, have placed substantial buy or sell orders. It serves as either support or resistance level. There are two types of order blocks:
In both instances, they typically create an impulse move that breaks a nearby high or low to continue or start a given trend. When the market returns to these areas, they often prompt a reversal of the short-term trend and a continuation of a higher timeframe trend.
Order blocks in forex are particularly telling due to the high market liquidity and the sheer volume of trades. Recognising these areas may help traders align their strategies with the likely actions of major institutional players, potentially leading to more informed trade decisions.
This pattern works because they tap into the underlying dynamics of supply and demand, reflecting the actions of large institutional players whose trades can significantly impact price direction. They’re essentially snapshots of where significant buying or selling pressure has accumulated, offering clues to future price movements.
When a market approaches a supply or demand zone, the likelihood of a reaction—whether it's a continuation or reversal of the trend—increases because these levels are where institutional traders have previously shown interest, either by initiating large positions or placing take-profit orders.
Now, let’s take a closer look at how traders identify and use order blocks.
Traders often start by analysing historical price charts to locate this pattern. Typically, these are found where there was significant trading activity, often in the form of a consolidation, followed by a strong directional price move.
Note that OB candles visible on a higher timeframe tend to be more probable. Similarly, a small high-low range on a lower timeframe would appear as a single candlestick on a higher timeframe, meaning that the entire range can be plotted as a supply or demand zone.
If you want to spot your own patterns, you may consider heading over to FXOpen’s TickTrader platform and interact with real-time charts.
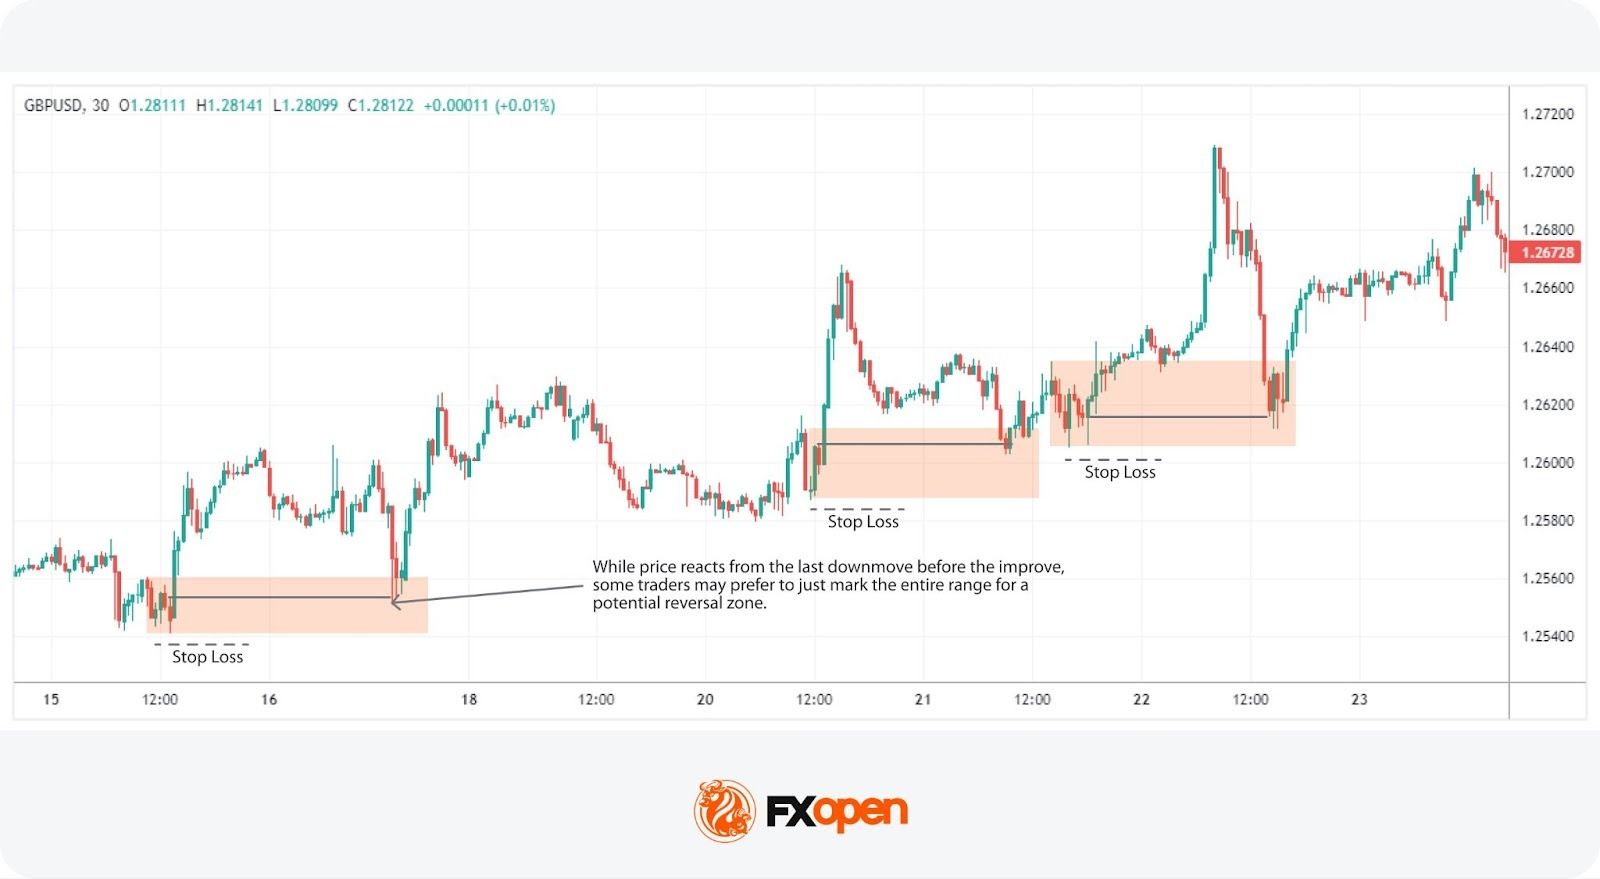
An order block trading strategy involves observing how the price behaves as it approaches these marked areas. For instance, a price bounce from a demand zone may be used by traders to place a buy order, anticipating upward momentum as institutional interest possibly resurfaces. In contrast, supply zones are analysed for signs of selling pressure as price revisits areas where sell-side orders were potentially previously concentrated.
Traders might also combine these areas with indicators and other analysis tools, such as moving averages or Fibonacci retracements, to validate their signals. This multi-faceted approach may support traders in developing their own entry and exit strategies.
As with any strategy, it's important to practise risk management when trading with order blocks. Traders often set stop-losses just outside the zone with the assumption that institutional players won’t let the market trade beyond this point. However, when these zones fail, they become known as breaker blocks.
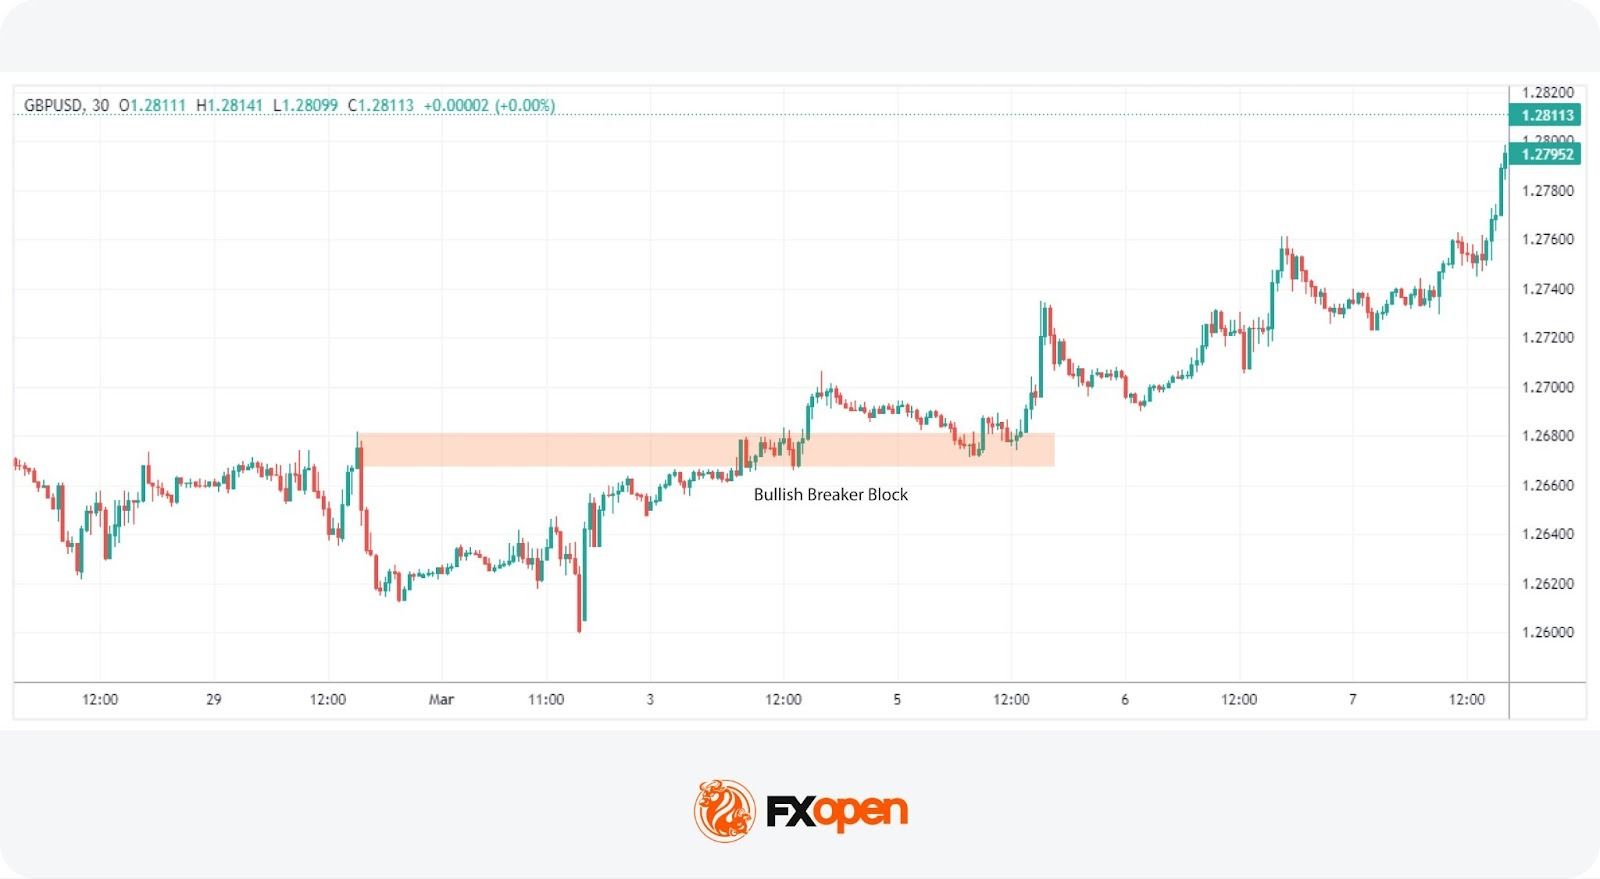
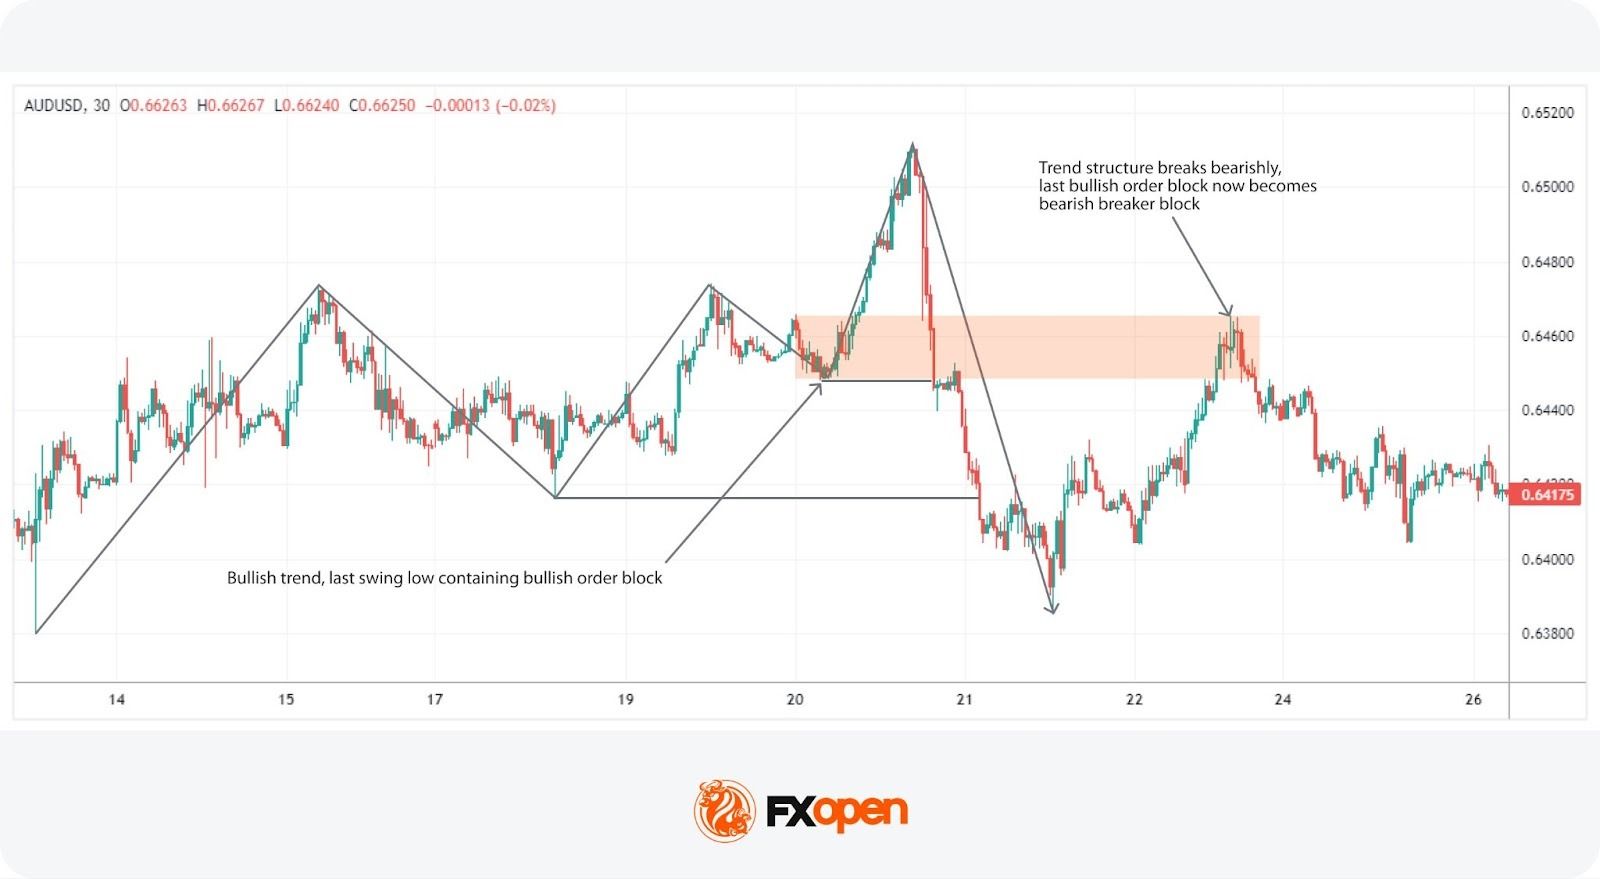
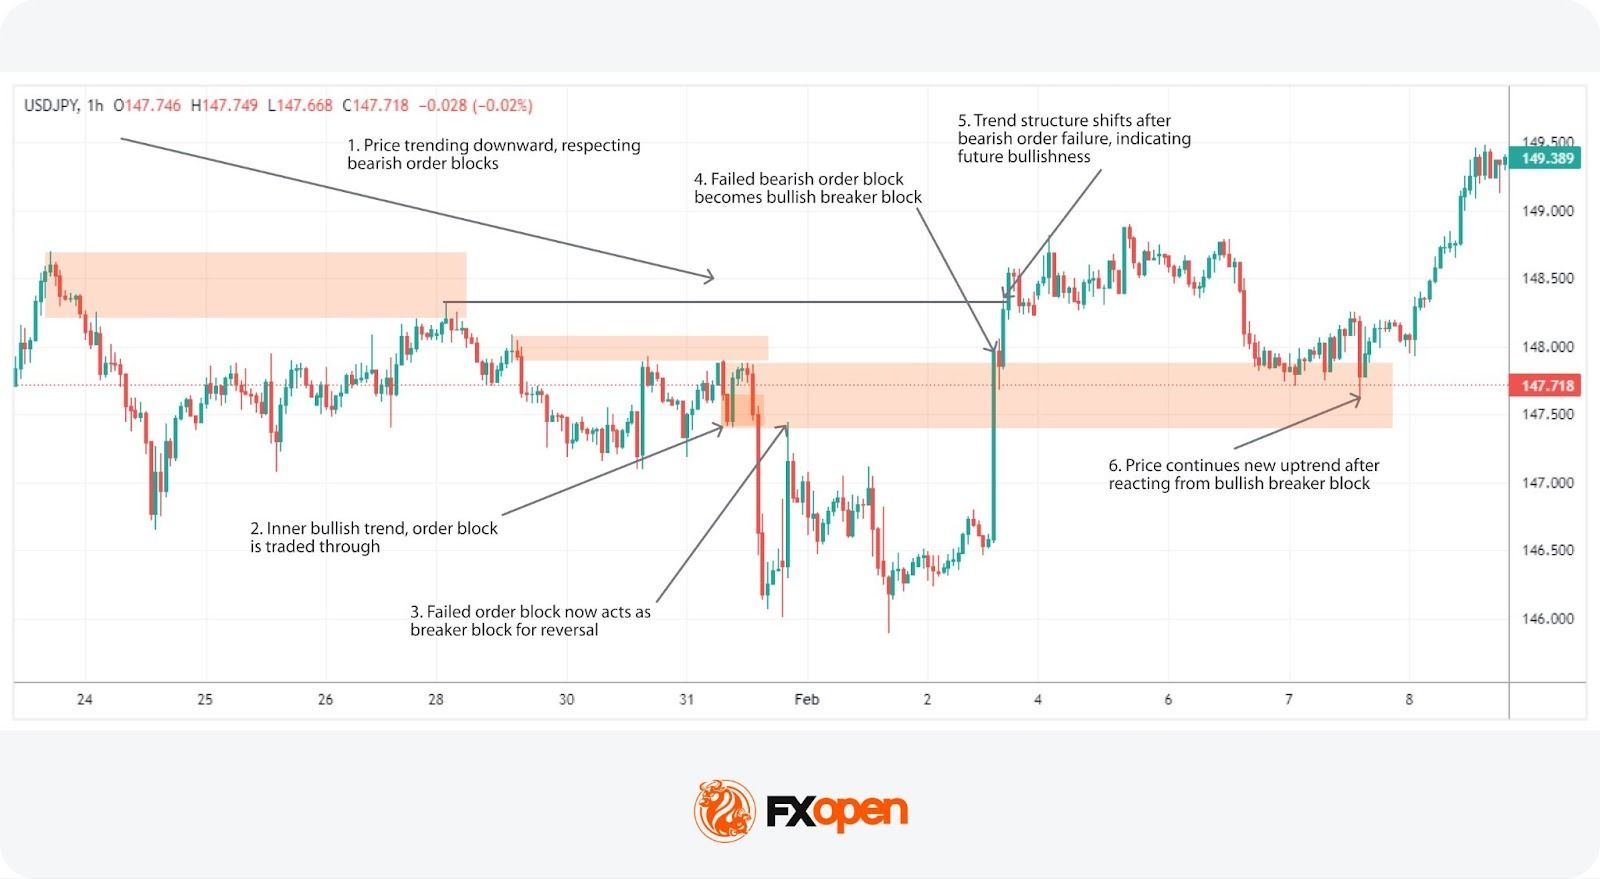
In forex, a breaker block forms when an OB fails and price decisively trades through it, signalling a shift in market structure. There are two types: a bearish and bullish breaker block, both of which use breached zones that act as a reference level on a retracement.
In both scenarios, price often retraces to the failed zone before continuing the newly formed trend.
To harness the power of breakers, traders adeptly identify these pivotal points and integrate them into a coherent strategy.
Traders analyse failed areas of supply or demand and the structure shift:Identifying an OB that aligns with the current trend and would need to hold for continuation.
Remember: a bearish breaker block forms when price breaks down through a bullish OB. A bullish breaker block forms when price rallies through a bearish OB.
Once identified, these zones can be strategically employed as markers for potential trade entries.
These two patterns are related, but they describe different stages of market behaviour. One focuses on where institutional activity first appears; the other reflects what happens when that activity no longer holds.
Feature | Order Blocks | Breaker Blocks |
Appearance | Mark areas of prior buy or sell concentration that price has not yet invalidated. | Appear only after an OB fails and structure flips. |
Structure | Align with the prevailing structure | Reflect a confirmed change. |
Analysis goal | Analysed for reactions. | Analysed for continuation after failure. |
Combining these two ideas offers a nuanced approach to forex, especially when integrating the concept of liquidity voids or fair value gaps. These gaps occur when the price makes an impulsive move away from an OB without retracing, potentially marking areas for future reversals. This strategy shines in trending assets, where the directional momentum aligns with the formation of these critical zones, offering potential entry and exit signals.
In a trending market, order blocks that prompt sharp price movements away can be key areas to mark for a trend reversal. These marked zones can indicate where significant buying or selling pressure originated, offering potential entry points. However, in a ranging or consolidating market, they might not hold as expected.
When institutional interests shift, leading to the failure of an order block to act as support or resistance, this is where breaker blocks come into play, becoming a critical level to watch. Particularly after a sudden move, if a supply or demand zone ripe for reversal is now too far away to see an immediate retracement, the breaker serves as a strategic entry point ahead of a trend continuation.
Breaker blocks may help set market direction and reflect potential entry points. The breach of an OB by price action indicates a strong likelihood that the asset will continue in that direction, underscoring a shift in institutional interest. When price trades through an order block, showing no signs of halting, it suggests a path for the trend, offering traders insight into the prevailing momentum.
While these patterns provide insightful strategies in navigating forex markets, they come with limitations that traders always consider:
An understanding of breaker blocks vs order blocks may support traders in navigating the forex market, as these concepts provide valuable insights into institutional order flow and market movements. By understanding how these structures form and the psychological dynamics behind them, traders can anticipate potential reversals or continuations. However, these patterns may provide false signals, so traders prefer to use them alongside broader market context, volume analysis, and strict risk management.
Those who want to apply these insights in real-time trading, may consider opening an FXOpen account, a gateway to the dynamic world of forex, connecting traders with global markets.
An order block refers to a price area on the chart where significant buy or sell orders were previously placed by large institutional traders. These zones are used as support or resistance levels, providing insights into future price movements.
A breaker block is a concept that emerges when an order block fails, leading to a change in market structure. Since order blocks are used as support and resistance levels, breaker blocks appear when the price breaks support/resistance level. These blocks signify a pivotal point where the market shifts direction, allowing traders to open a trade based on anticipated trend continuation.
Order blocks can be identified by analysing price charts for areas where there was significant trading activity, followed by a strong directional movement. Traders look for the last bullish candle before a downturn for a bearish block, or the last bearish candle before an uptrend for a bullish block, indicating potential zones of interest for traders.

