XRP was trading near $1.004 on August 17 after moving between roughly $0.987 and $1.006 during the daily session. The bounce brought price into contact with the descending trend line that has limited recovery attempts since late July.
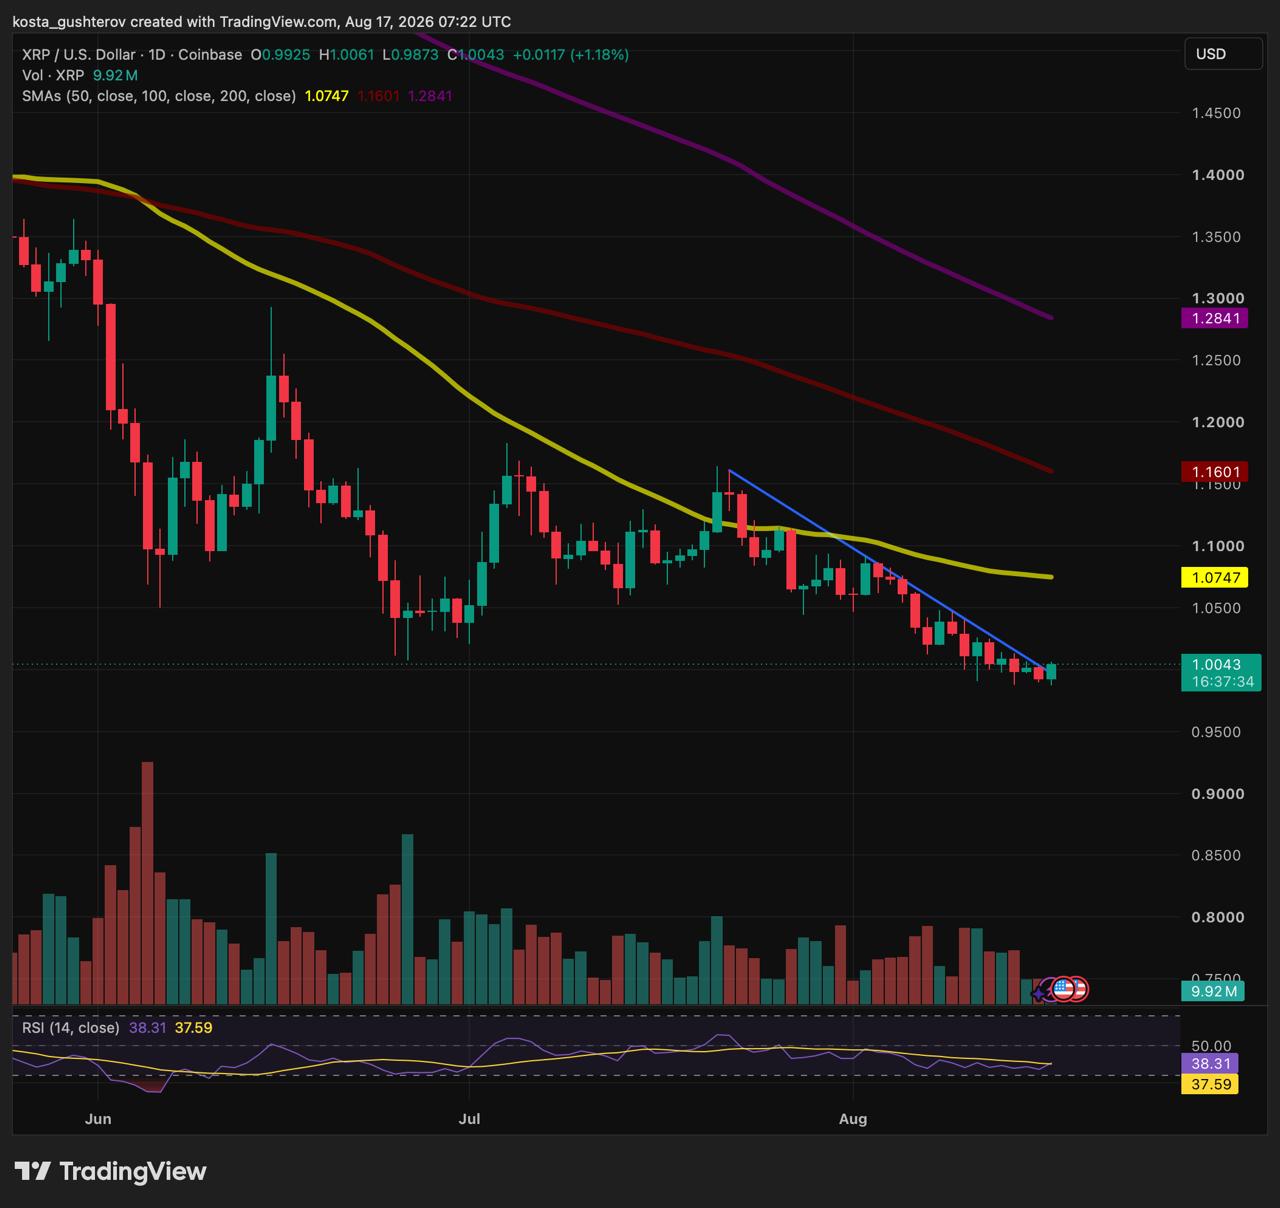
That is the immediate test. XRP has reached the line but has not yet confirmed a daily close above it. Until that happens, the move is better read as a stabilisation attempt than a breakout.
The broader chart remains weak. The 50-day simple moving average sits near $1.075, with the 100-day SMA around $1.16 and the 200-day SMA near $1.28. All three are above the current price. The 50-day average is the first active technical barrier; the higher averages become relevant only if XRP can recover further.
CoinGlass data shows about $1.23 billion in XRP futures volume over 24 hours at the time of writing, compared with roughly $152.9 million in spot volume so futures turnover was about eight times larger than spot turnover. Open interest stood near $2.77 billion.
The figures describe the mix of activity, not its direction. Futures volume does not reveal whether buyers or sellers have control, and open interest does not identify whether the outstanding positions are mainly long or short.
What the data does show is that XRP is being traded heavily through derivatives while it tests $1. That can make a break of the current range less orderly if a large number of positions are closed or liquidated.
The intraday low near $0.987 is the immediate level to watch. A wick below it would not settle the issue on its own. A daily close beneath it, followed by a failed attempt to recover $1, would show that the current stabilisation attempt has failed.
The daily chart does not show a clearly tested support zone directly below the current range. It would be more accurate to wait for fresh price action than assign a precise downside target now.
The trend line is the first obstacle, but the $1.02-$1.04 area carries more weight because it contains several recent daily highs. A close above that range, followed by a successful retest, would be the first condition for a higher-low and higher-high sequence.
A brief intraday move above the line would not be enough.
The 50-day SMA near $1.075 is the next level that matters. A recovery above it would not reverse XRP’s wider decline, but it would show that price has moved above its nearest falling average.
The current daily volume has not expanded to the levels seen during the larger swings in June and July. The session is still open, so that can change. At the time of the chart, however, the bounce lacked a comparable expansion in volume.
XRP is at the bottom of its recent range, where even a small move can look more important than it is. The chart will improve only if price holds above $1, closes through $1.02-$1.04 and then tests the 50-day SMA near $1.075.
The derivatives data adds context rather than a prediction. It shows that traders are active around the level, so the first break may be volatile. The daily close and the follow-through after it will matter more than the initial move.
Cryptocurrency prices are highly volatile. Technical levels are based on the daily chart from TradingView, and derivatives data can change rapidly. This article is for informational purposes only and does not constitute investment advice.
The post XRP Near $1: Is Futures Trading Enough for a Recovery? appeared first on Coindoo.





