XRP regained traction after sliding toward $1.32, the weakness covered in our earlier XRP price report. The latest advance has not reversed the full decline from $1.70, but it has created a clear support area for buyers to defend.
The move also arrived during a broader large-cap recovery, as explained in our crypto market analysis. That broader bid gives XRP support, but the token’s own chart now has a separate test.
On the daily XRP/USD chart, price was trading above the upper boundary of its recent descending channel when the chart was captured. This suggests that selling pressure may be easing, although the move still needs follow-through.
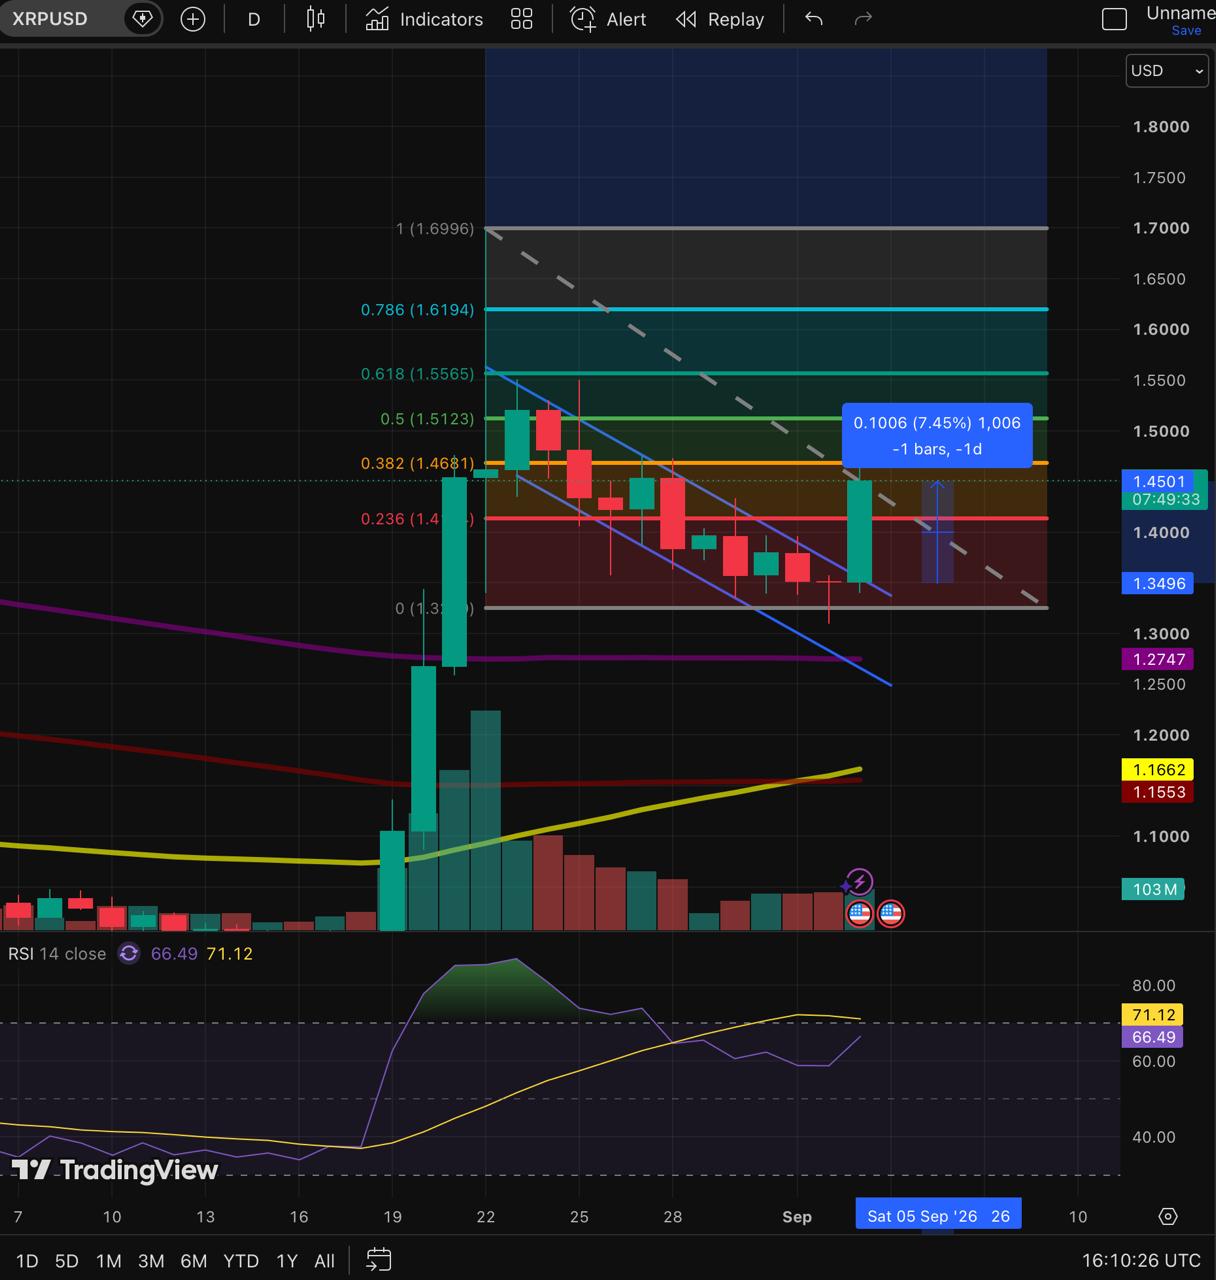
The Fibonacci range on the chart runs from the roughly $1.32 swing low to the prior high near $1.70. XRP has moved back above the 23.6% retracement near $1.41, but it was still trading below the 38.2% level at $1.47.
A daily close above $1.47 would show that buyers have moved beyond the first bounce from support and begun to reclaim the earlier decline. Until then, the move remains a recovery attempt rather than a confirmed trend reversal.
XRP’s daily-chart decision levels
$1.41
The first reclaimed Fibonacci level. Holding above it keeps the latest advance intact.
$1.47
The 38.2% retracement and the first meaningful resistance level on the recovery.
$1.51 to $1.56
The 50% and 61.8% retracements. They become relevant only after resistance breaks.
Daily RSI was near 66.5 on the chart, up from the weaker readings seen during the pullback but still below the conventional 70 overbought threshold. That shows improving momentum without, by itself, confirming that the decline is over.
The chart sets the levels, while derivatives data can help show the quality of demand behind them. The live XRP futures dashboard on CoinGlass tracks open interest, funding, spot volume and liquidations.
Rising open interest is not automatically bullish or bearish. It can reflect new conviction, but it can also mean that a move is becoming dependent on leveraged traders who may be forced out if price reverses.
Healthier confirmation
Spot activity rises, funding remains calm and XRP holds above its newly reclaimed support.
Less reliable advance
Open interest and funding jump sharply while price stalls, leaving leveraged buyers exposed to a pullback.
A loss of $1.41 would put the first recovery attempt under pressure and bring the $1.35 area back into focus. A move below the roughly $1.32 swing low would show that sellers still control the daily structure.
For now, XRP has interrupted its decline. A sustained move higher still depends on buyers proving that the latest demand can hold after the initial jump.
The article is provided for informational purposes only and does not constitute investment advice.
The post XRP Price Jumps 7% After $1.32 Test – Can It Clear $1.47? appeared first on Coindoo.





