Last week, we published a post titled “Ahead of Nvidia’s (NVDA) Earnings: How the Price Could Move”, in which we:
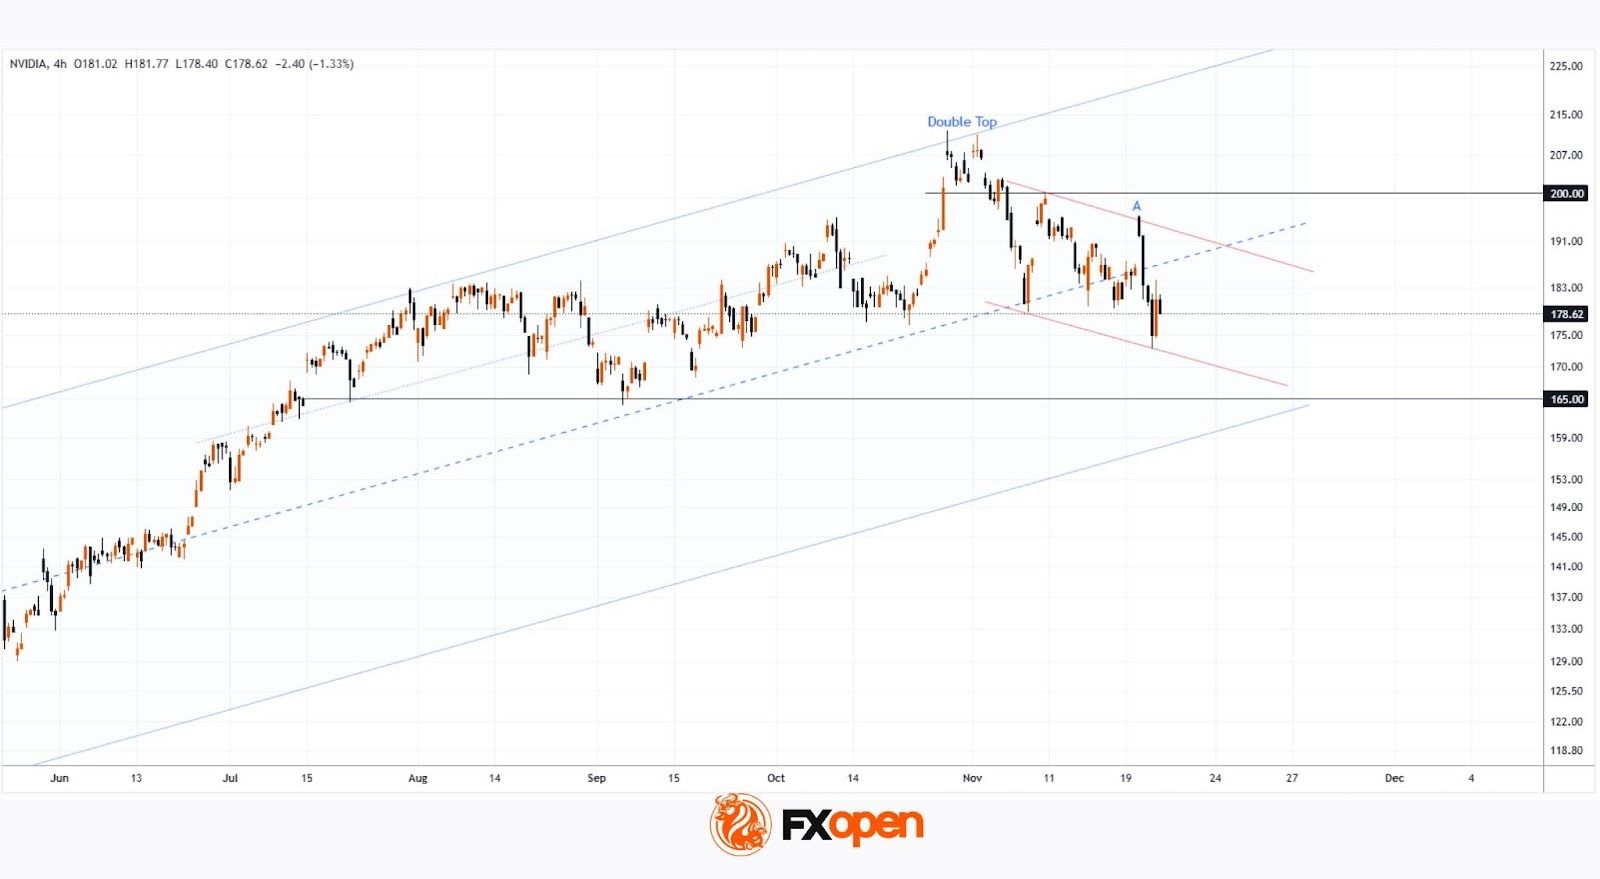
→ Drew an ascending channel (shown in blue);
→ Suggested that market participants’ overly high expectations would likely not be met when earnings were released, leading to a decline in NVDA’s price towards the lower boundary of the ascending channel, where support lies at $165.
In reality, the earnings report turned out to be very strong:
→ Gross revenue: actual = $57bn, forecast = ~$54.9bn.
→ Earnings per share (EPS): actual = $1.30, forecast = $1.26 (previous quarter = $1.05).
The surge in price with a bullish gap towards point A reflected the initial reaction to the strong figures, but the share price then began to fall (reaching a two-month low), thereby confirming our expectations.
Technical Analysis of the Nvidia (NVDA) Chart
An analysis of NVDA’s price action suggests that the current situation can be viewed as a correction (shown with red lines), forming within an expanded ascending channel.
If NVDA’s share price declines towards the $165 level, where the lower boundary of the channel lies, this could encourage the bulls to attempt to resume the 2025 uptrend and mount a new push towards the psychological $200 mark.

