
LayerZero reached an all-time quarterly high in Q4, signaling the growing dominance of the OFT standard as the leading method for cross-chain value transfers.
According to Token Terminal, activity is expanding beyond traditional EVM networks, reflecting broader global adoption. Integration with Sui drove immediate TVL growth for Bitcoin-based assets, highlighting increasing demand for cross-chain liquidity solutions.
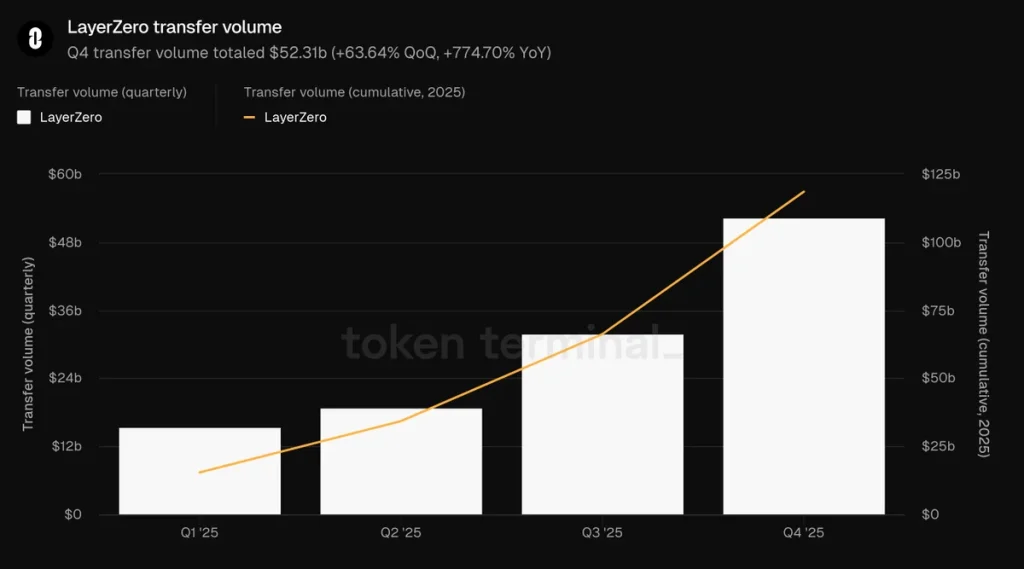
Source: Token Terminal’s X Post
The protocol also extended its reach to new ecosystems, with TON introducing USDT0 to Telegram users and bridging mainstream audiences. Aptos and Starknet integrations connect Move and StarkVM architectures to the same cross-chain rails, promoting interoperability.
These developments position LayerZero as a foundational layer for multi-chain operations, uniting legacy and next-generation blockchains under a single, seamless value-transfer framework.
Also Read: LayerZero (ZRO) Higher Lows Signals a Potential Breakout Toward $2.58
After the strong Q4 growth, ZRO rises with significant volatility to begin early 2026. The last move pushed against the upper Bollinger Band at the $2.20 level.
However, it encountered a 5.69% loss for the day. According to TradingView, ZRO is trading above the 20-day EMA at the $1.89 level. This is important to maintain the bullish setup to avoid a deeper loss to the $1.82 level.
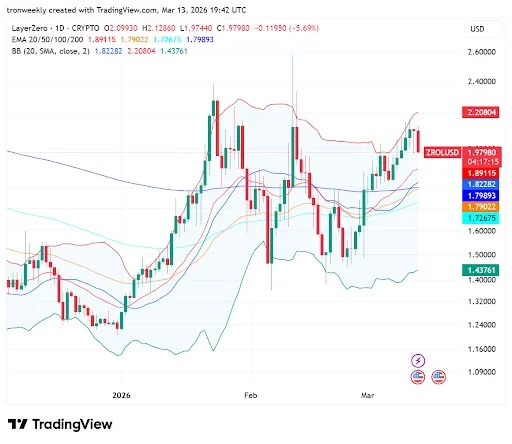
Source: TradingView
The long-term indicators are also positive since the 50-day, 100-day, and 200-day EMAs are all located below the current price, nestled between $1.72 and $1.80.
The latest red candle suggests a possible cooling effect. Traders should be watching for a consolidation period before the price attempts to test the $2.20 resistance again.
The relative strength index for ZRO is at 56.98. This means that there has been a shift away from the bullish zone.
The fact that the RSI line is going below the moving average means that the previous momentum is slowing down considerably. This means that the asset is not oversold; rather, the buying pressure has stopped for now.

Source: TradingView
The MACD indicator also corroborates this turning point, wherein the histogram bars are tapering out even though the blue line stays above the orange line.
This indicates that the uptrend is weakening. A fall in the MACD line below the signal line will confirm a bearish reversal pattern, targeting the key $1.80 price level.
This article contains market analysis and price predictions. These are not guarantees. Crypto markets are volatile. Always DYOR. Not financial advice.
Also Read: ZRO Forms Rare Bull Pattern – Last Chance Before 60% Surge


