
LINK’s rebound from the $12 support area, tightening compression, and rising momentum signal a potential trend reversal. With price stabilizing above $13.30, traders are watching for a decisive move toward higher resistance levels.
Chainlink continues to trade within a broad multi-year range, and recent movements suggest that the asset is approaching an important technical point. The price has climbed from the well-defined $12–$14 demand area, a zone where buyers have repeatedly entered the market since 2022.
The current advance has carried the asset toward a multi-year descending trendline that originated near the 2021 peak. This level remains a key reference point for traders watching for a broader trend shift.
Market data shows that Chainlink has maintained one of the strongest long-term support blocks in the sector. The lower range between $5 and $10 has been tested on several occasions, each time attracting steady spot accumulation.
Analysts tracking these patterns note that the latest upward movement is the strongest reaction from support in nearly two years, reflecting firm interest among buyers as the price approaches major resistance.
Analyst Ray stated that its repeated defenses of its accumulation zone continue to support a stable long-term structure. According to his assessment, the asset may be transitioning from consolidation into a possible expansion phase after years of compressed volatility. This view is based on the recent strong move toward the downtrend line, which remains the primary boundary separating the altcoin from higher price levels.

LINKUSD Chart | Source:x
Ray’s broader market commentary suggests that many long-term participants view the current structure as favorable for gradual accumulation. He indicated that the pattern of multiple strong rebounds from the same support level often acts as a foundation for future upward movement. If the asset closes above the descending trendline, traders are watching potential zones near $28–$32 and the larger liquidity block near $58 as medium-term areas of interest.
On shorter timeframes, analyst FLASH pointed to a falling-wedge pattern forming on the eight-hour chart. This pattern has developed over several weeks through consistent lower highs and lower lows, bringing the price to a compression point near the apex. The altcoin recently bounced from the $12 zone, a move that brought the asset back to the upper boundary of the wedge near $13.30.
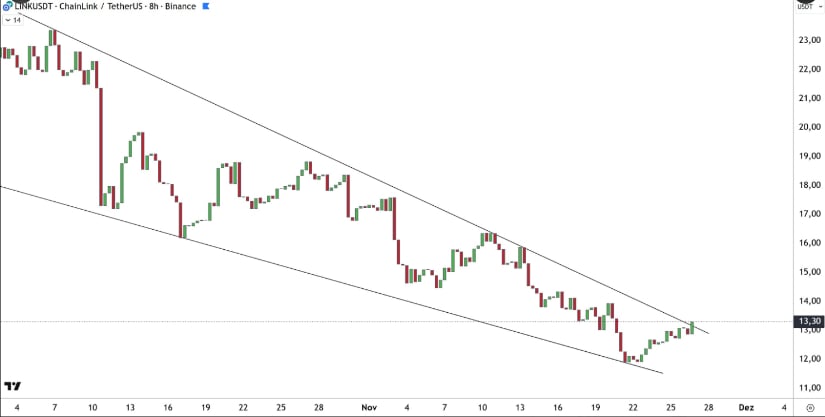
LINKUSDT Chart | Source:x
FLASH remarked that the current position places the token in a zone where a break above the wedge resistance could shift momentum. The $15–$17 region contains previous supply, and traders are monitoring whether strong buying pressure can carry the asset into that range. The compression within the wedge reflects reduced selling pressure, a condition that often precedes more decisive price movement.
During the latest session, Chainlink traded near $13.48, posting a modest 2.88% gain. The price briefly dipped toward $12.80–$12.85 before rebounding as buyers stepped in at short-term support.
The defense of this zone prevented deeper losses and created a base for an upward move through the $13.20–$13.30 intraday band. Volume near $582 million accompanied the recovery, indicating active participation during the bounce.
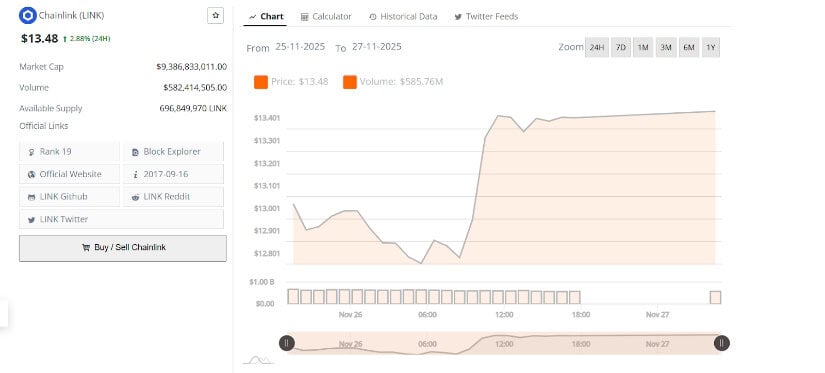
LINKUSD 24-Hr Chart | Source: BraveNewCoin
The chart shows the price stabilizing around $13.40–$13.45, a region acting as a nearby resistance ceiling. LINK’s ability to maintain levels above $13.30 signals firm interest from buyers as the market enters a compressed phase. If the asset retains its current structure, a move toward the $13.50 psychological level becomes possible. If support near $13.20 weakens, a retest of the $12.90 band remains a near-term watch point for traders assessing momentum.

