
Liquidity zones are areas where large buy and sell orders cluster, often acting as support or resistance. Liquidity voids (or imbalances) are fast price moves where little trading occurred, and price often returns to fill them.
Traders use liquidity zones to identify entry and exit points, while liquidity voids may help anticipate retracements and continuation moves.
This article explains how liquidity zones and liquidity voids function in market structure and highlights their role on price charts.
Feature | Liquidity Zones | Liquidity Voids |
Activity | High | Low |
Price behavior | Slows / reacts | Moves fast |
Role | Support/resistance | Imbalance |
Strategy | Reversals / breakouts | Mean reversion |
Liquidity zones and liquidity voids differ primarily in how order flow is distributed and how price behaves within each environment.
In liquidity zones, trading activity is elevated due to the presence of clustered orders around previous highs, lows, or consolidation ranges. This concentration of liquidity typically causes prices to slow down, rotate, or produce reactions, reinforcing their role as support and resistance areas.
In contrast, liquidity voids form during strong directional moves, leaving behind areas where little trading activity has previously occurred. As a result, when price revisits these regions, it often moves quickly due to the absence of significant opposing orders.
Liquidity zones are generally associated with reversal or breakout strategies, where traders anticipate interaction between buyers and sellers. Liquidity voids, however, are typically approached with mean reversion expectations, as the market tends to rebalance prior inefficiencies.
In trading, liquidity refers to how easily an asset can be bought or sold without significantly affecting its price. High liquidity means there are enough buyers and sellers at a given price level, facilitating smoother transactions. This concept is critical because it affects how quickly and at what price a trader can enter or exit positions.
Assets with high liquidity tend to have tighter spreads, which may reduce trading costs.
Conversely, assets with low liquidity can experience abrupt price movements due to limited order flow. Understanding liquidity may help traders make decisions.
These dynamics give rise to two important phenomena in trading: liquidity zones and voids. Liquidity zones are areas with a high concentration of trading activity, while liquidity voids represent gaps in the market where trading activity is sparse, each presenting unique conditions for trading strategies.
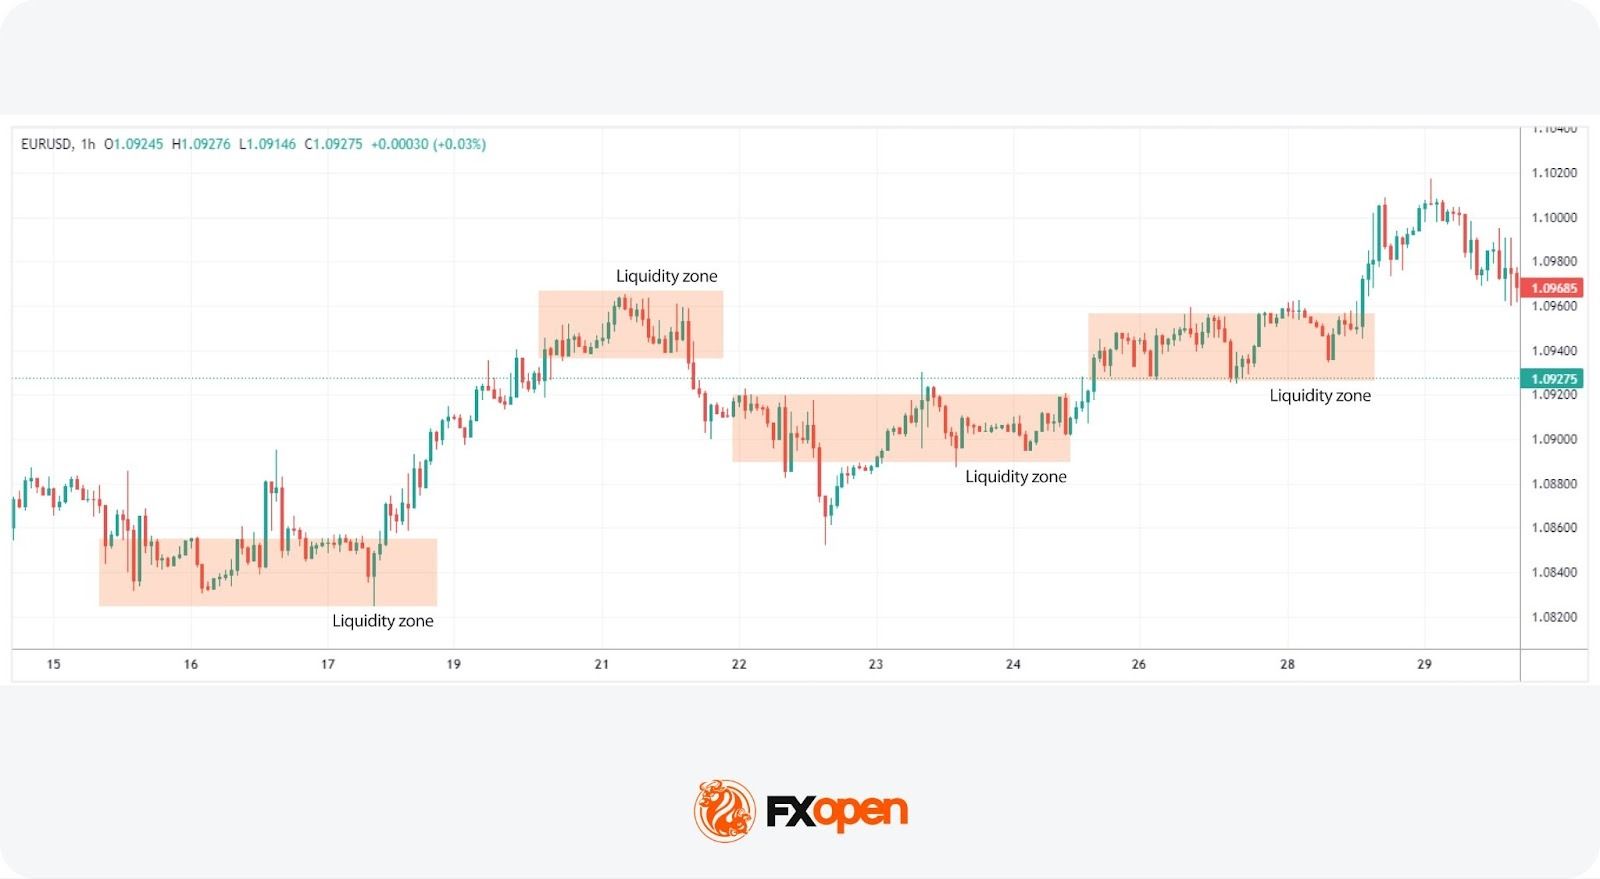
Liquidity zones (also called liquidity levels) are specific areas on a price chart where trading activity is highly concentrated. These zones indicate areas where large orders can be executed with minimal price impact.
Forex liquidity zones highlight areas where currency pairs tend to see higher activity.
These areas may be useful for identifying reversals or breakouts, providing reference points for entries and exits.
These zones often form around historical price levels where significant trading activity has occurred. They often act as magnets, attracting future price movement due to expected order flow. Liquidity levels are commonly associated with support and resistance. When price approaches these levels, traders can expect increased order flow, which may lead to clearer price reactions.
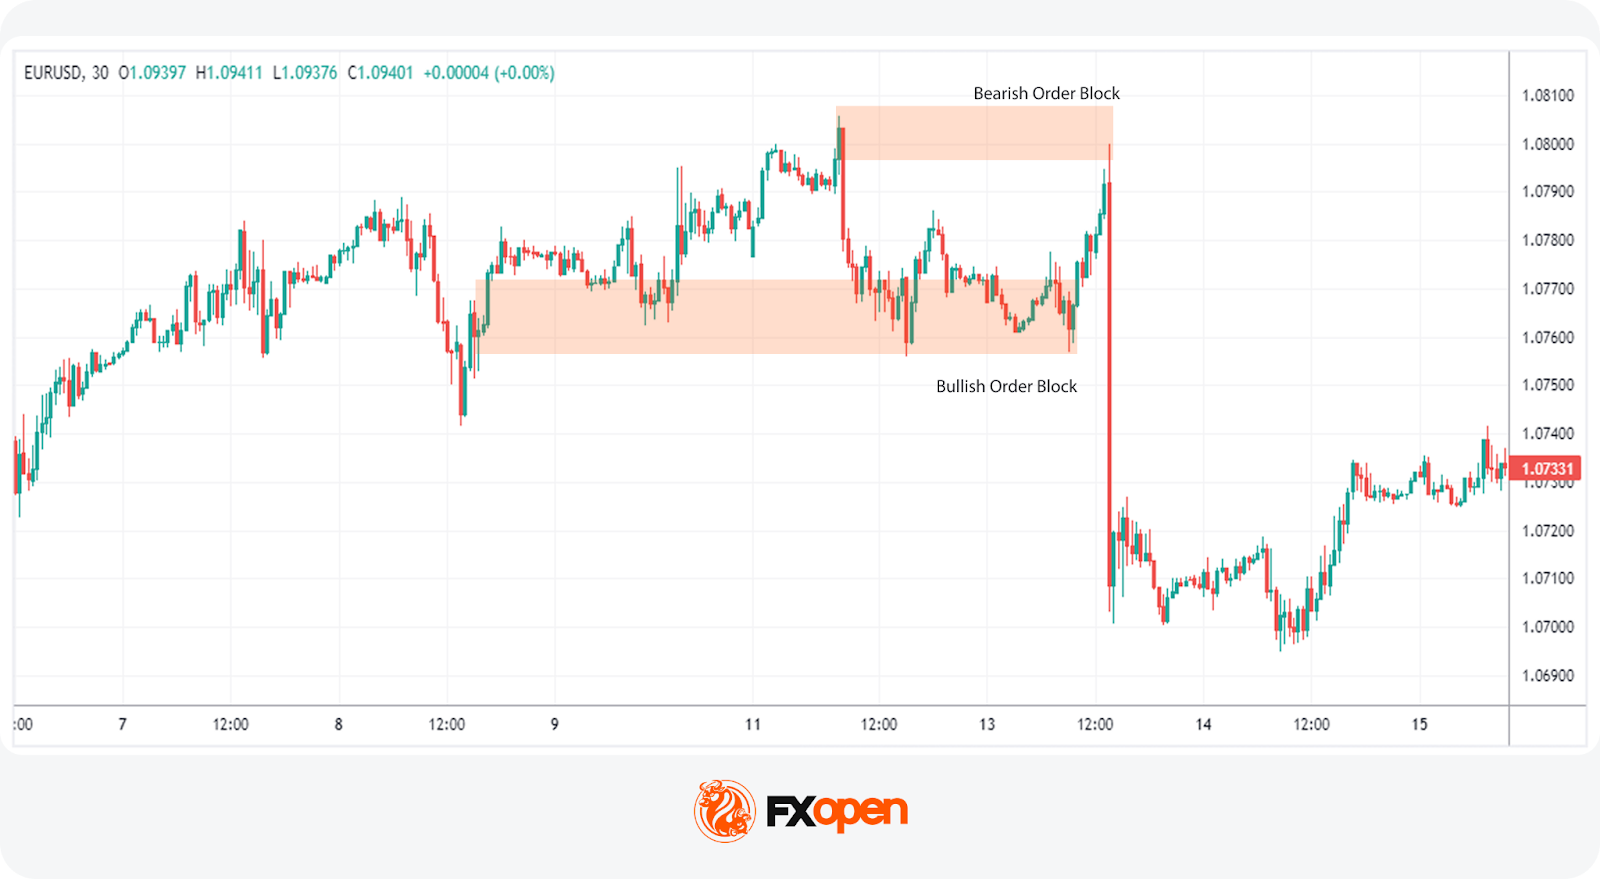
Feature | Liquidity Zones | Order Blocks |
Definition | Areas on a chart where a large volume of buy and sell orders cluster together. | The last bullish or bearish candle that forms before a strong move in the opposite direction. |
Formation | These form gradually as price revisits a level multiple times, allowing resting orders to build up. | Order blocks form from a single institutional candle that appears just before an impulsive price move. |
Size | They tend to cover a wider price range because they reflect accumulated trading activity over time. | They are typically narrower, defined only by the high and low of one specific candle. |
Purpose | They represent areas where price is likely to react due to concentrated supply or demand pressure. | They mark specific price points where institutional traders are thought to have placed large orders. |
Usage | Traders watch for reversals, reactions, or breakouts when the price returns into these broader zones. | Traders look for prices to return to the block and show signs of trend continuation. |
Traders identify liquidity zones using volume, price structure, and historical levels. Liquidity zone trading depends on accurately identifying areas where trading activity is concentrated. These levels highlight regions of high volume and may act as pivot points for price action.
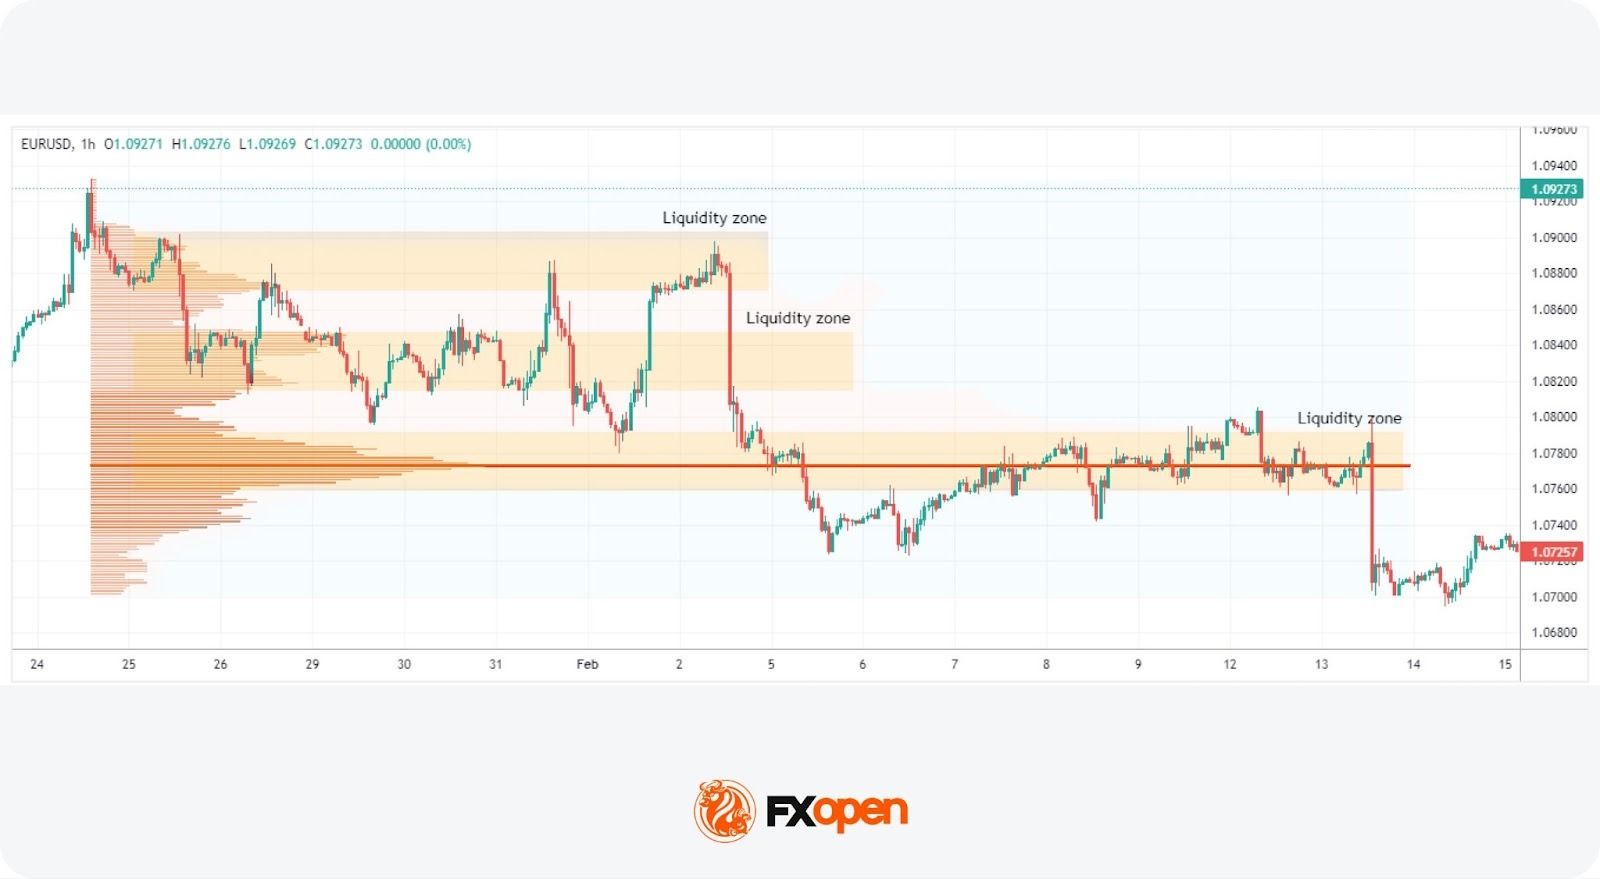
This approach uses the volume profile to show where most trading activity has occurred.
Unlike traditional indicators that display volume over time, the volume profile shows volume at specific price levels. This may help traders identify peaks in volume, highlighting areas of significant liquidity.
To use the volume profile tool as we have in the picture above, you can head over to FXOpen’s TickTrader trading platform and search for “Volume Profile Fixed Range” under the Indicators tab.
Recognising zones where the price has consolidated for a notable period is another method. These areas represent a tug-of-war between buyers and sellers, resulting in a high volume of trades. Such levels often act as magnets for future price action, making them critical for liquidity area trading.
Historical support and resistance levels are invaluable for spotting zones. These are levels at which significant reversals or pauses in trend have occurred, indicating areas where large volumes of orders may accumulate. When price approaches these levels again, it often does so with increased trading activity, making them prime candidates for liquidity areas.
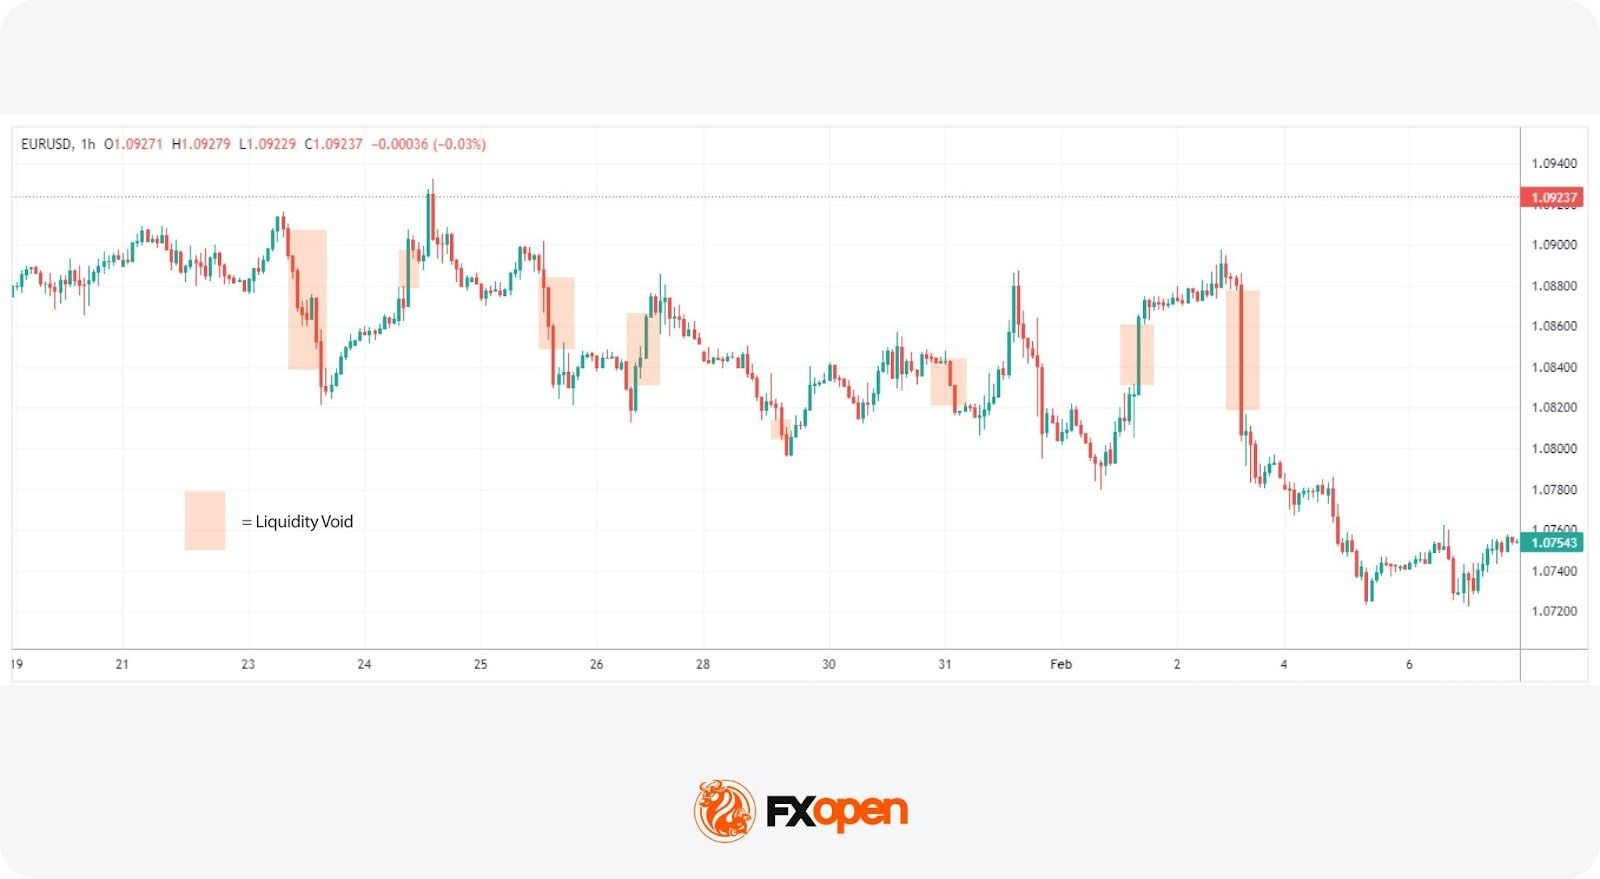
Liquidity voids (imbalances) are rapid price movements where little trading activity occurs between two levels. These gaps can lead to abrupt price changes and are often visible as sharp moves on a chart.
A liquidity void in forex signals an imbalance between buyers and sellers, causing prices to move quickly. This can result in sharp price movement as the market seeks a new equilibrium. These voids often occur after major news releases, during low-liquidity periods, or due to large institutional trades.
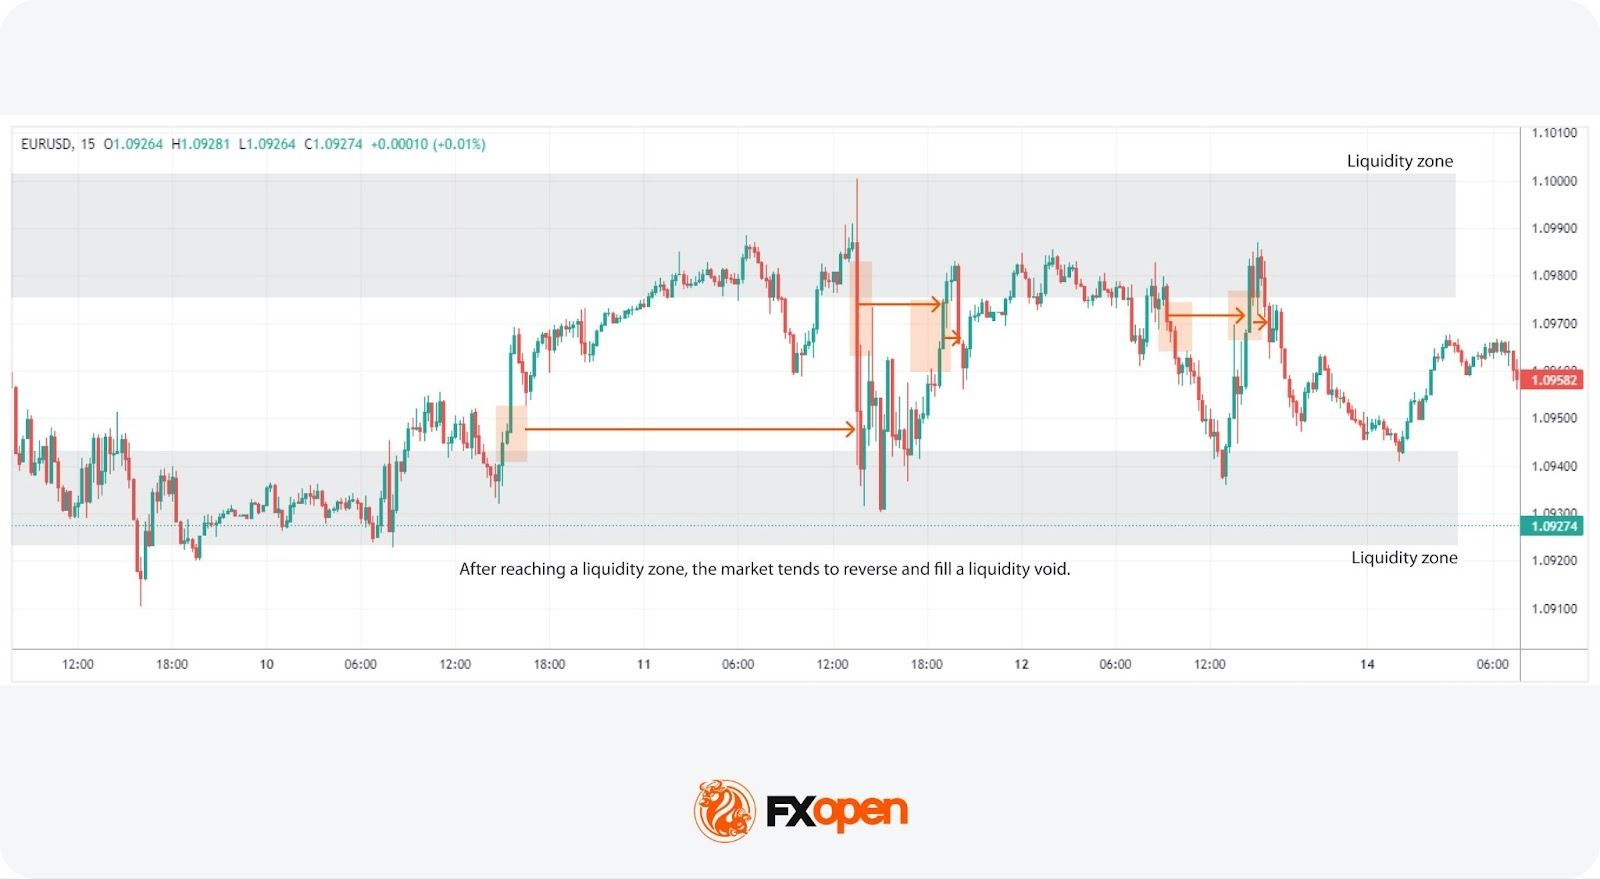
Their impact extends beyond the initial move. They represent areas where the market has not established a consensus price, which may lead to increased volatility later. Prices often return to these areas to “fill” the imbalance and restore balance in the market.
Traders navigate the increased volatility and unpredictability associated with these gaps but can also strategise to take advantage of the potential return to equilibrium.
Liquidity voids can be classified based on where they appear in a trend. Liquidity voids in the forex market manifest in various forms, each with distinct characteristics and implications for traders. Understanding the different types of voids may support traders in navigating these challenging areas. Some notable types of liquidity voids are common, exhaustion, breakout, and runaway. Let’s take a look at them:
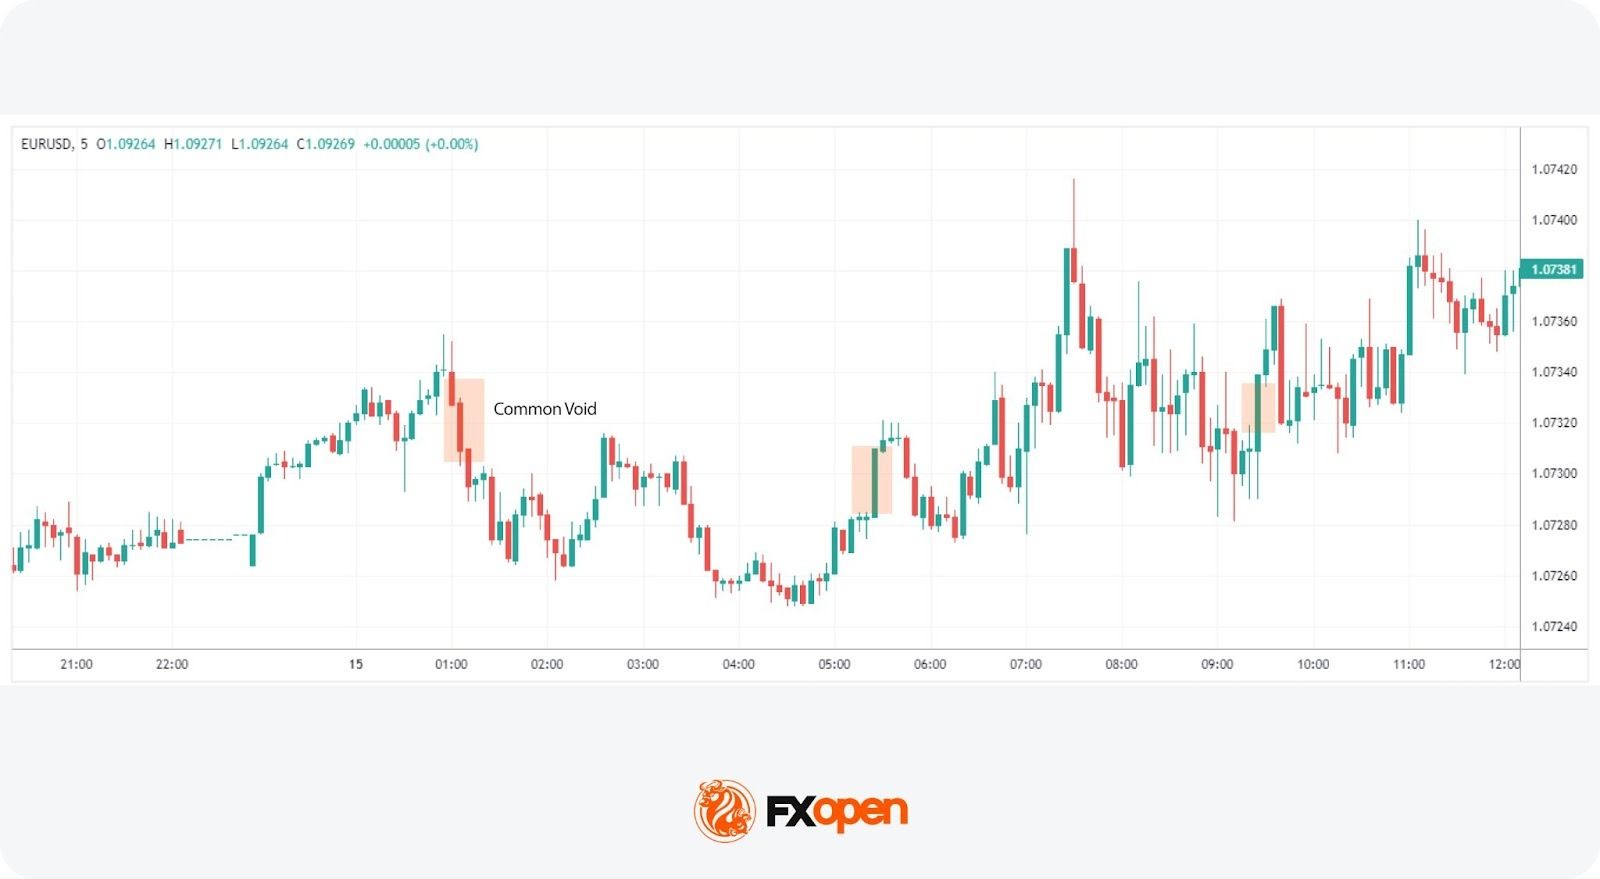
Common voids appear randomly across charts without any news or event trigger, forming from natural market ebb and flow. They don't always carry significant analytical value but are still worth monitoring for risk management purposes.
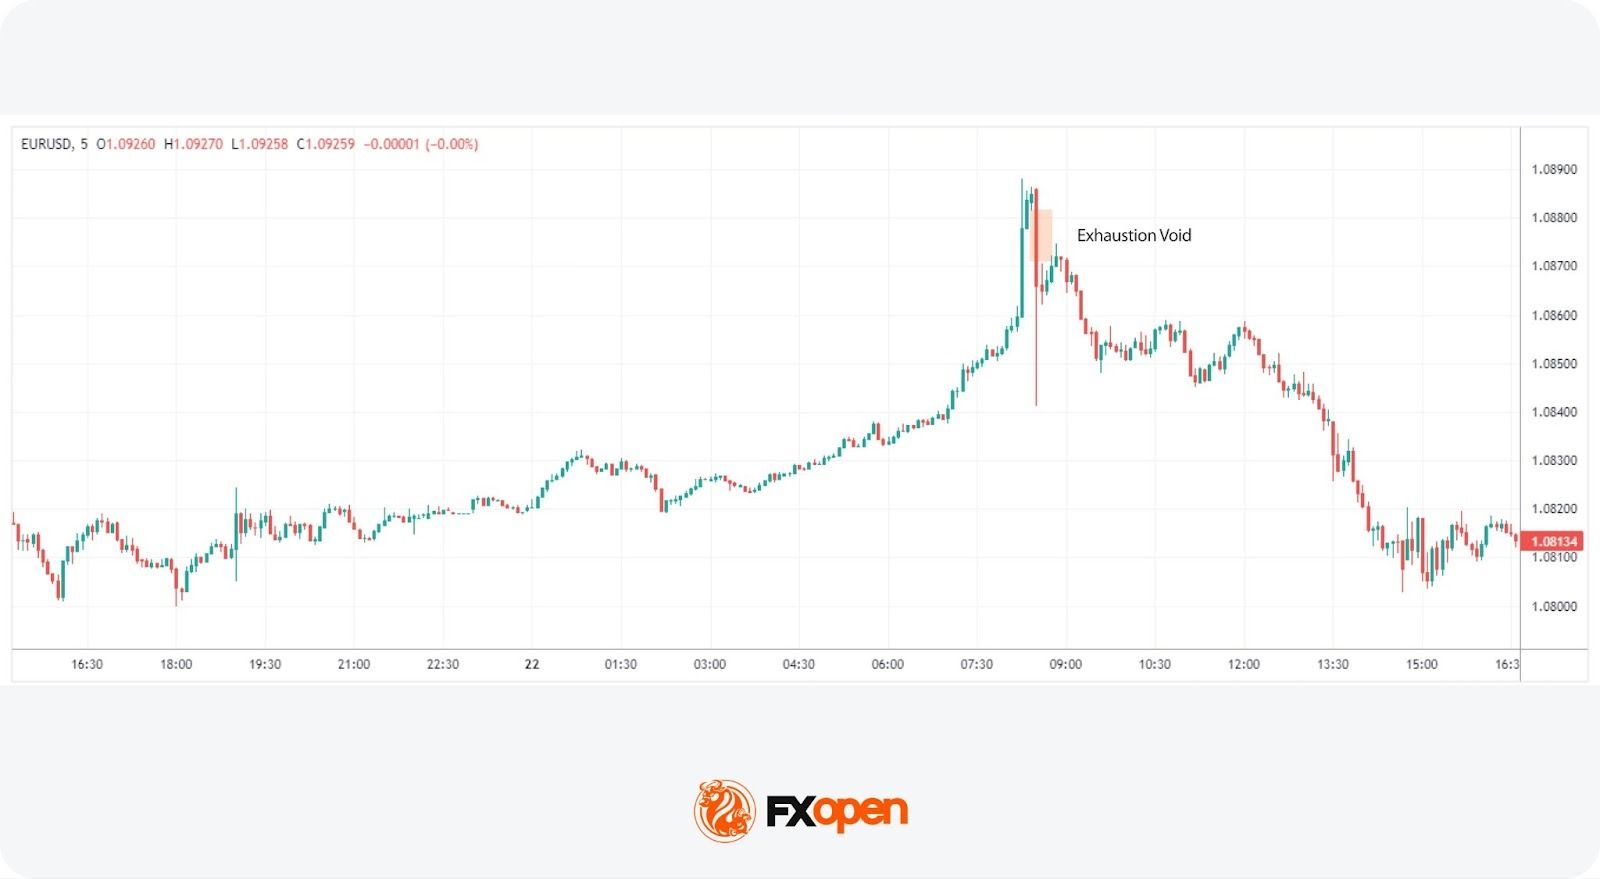
Exhaustion liquidity voids appear at the end of a trend when momentum fades and price makes a final push before reversing. Traders often watch for them as potential signals of a trend reversal.
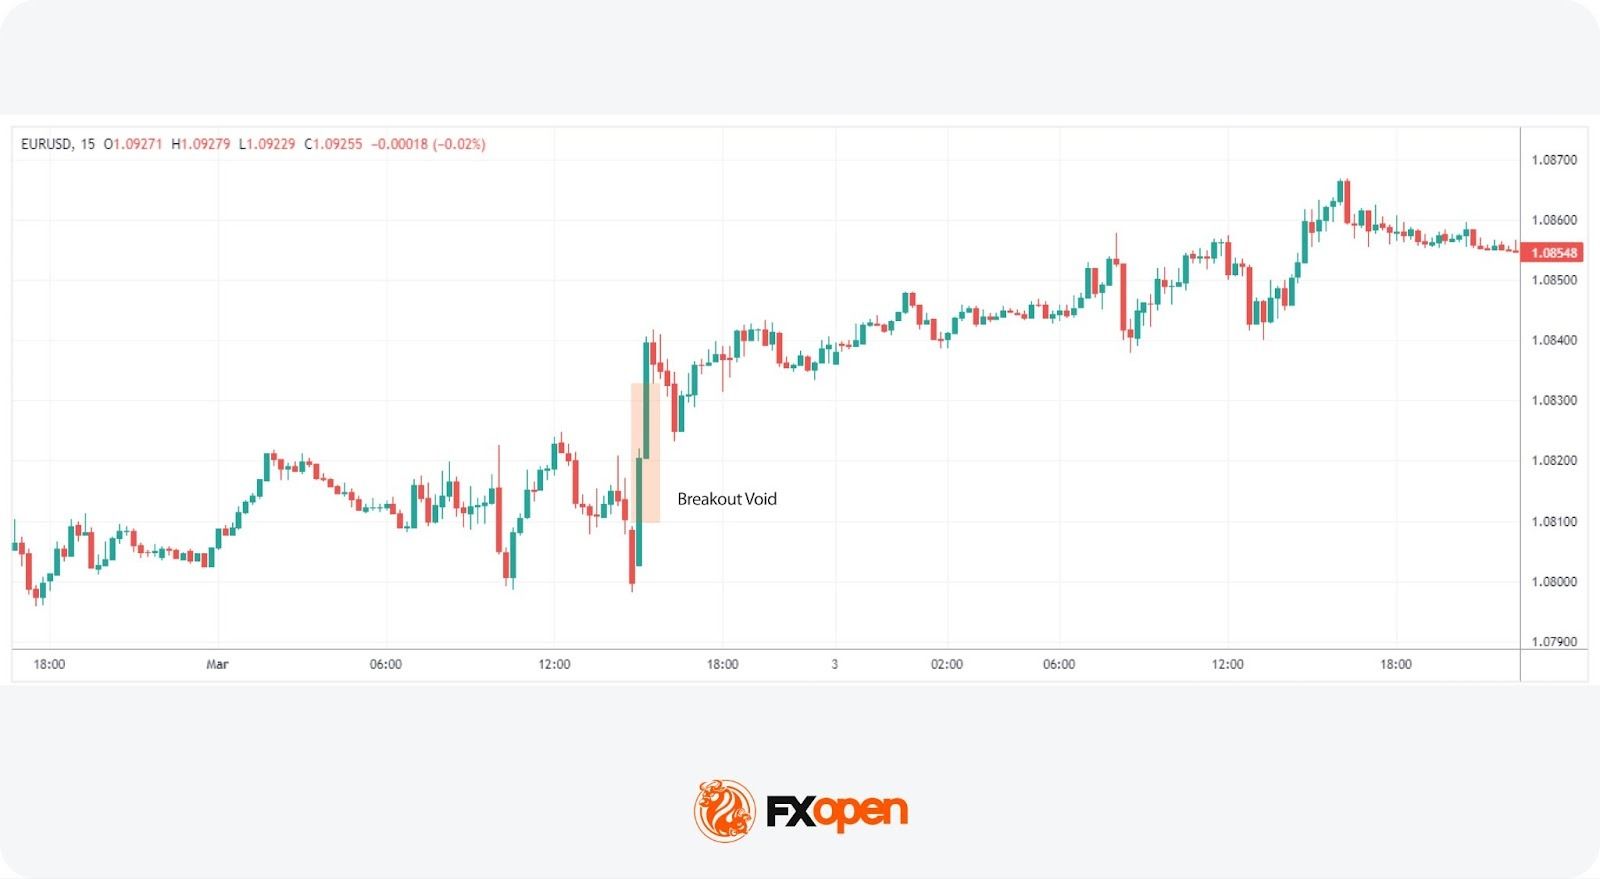
Breakout voids form when price breaks through a key support or resistance level with enough force to leave behind an imbalance. They often signal the beginning of a new trend.
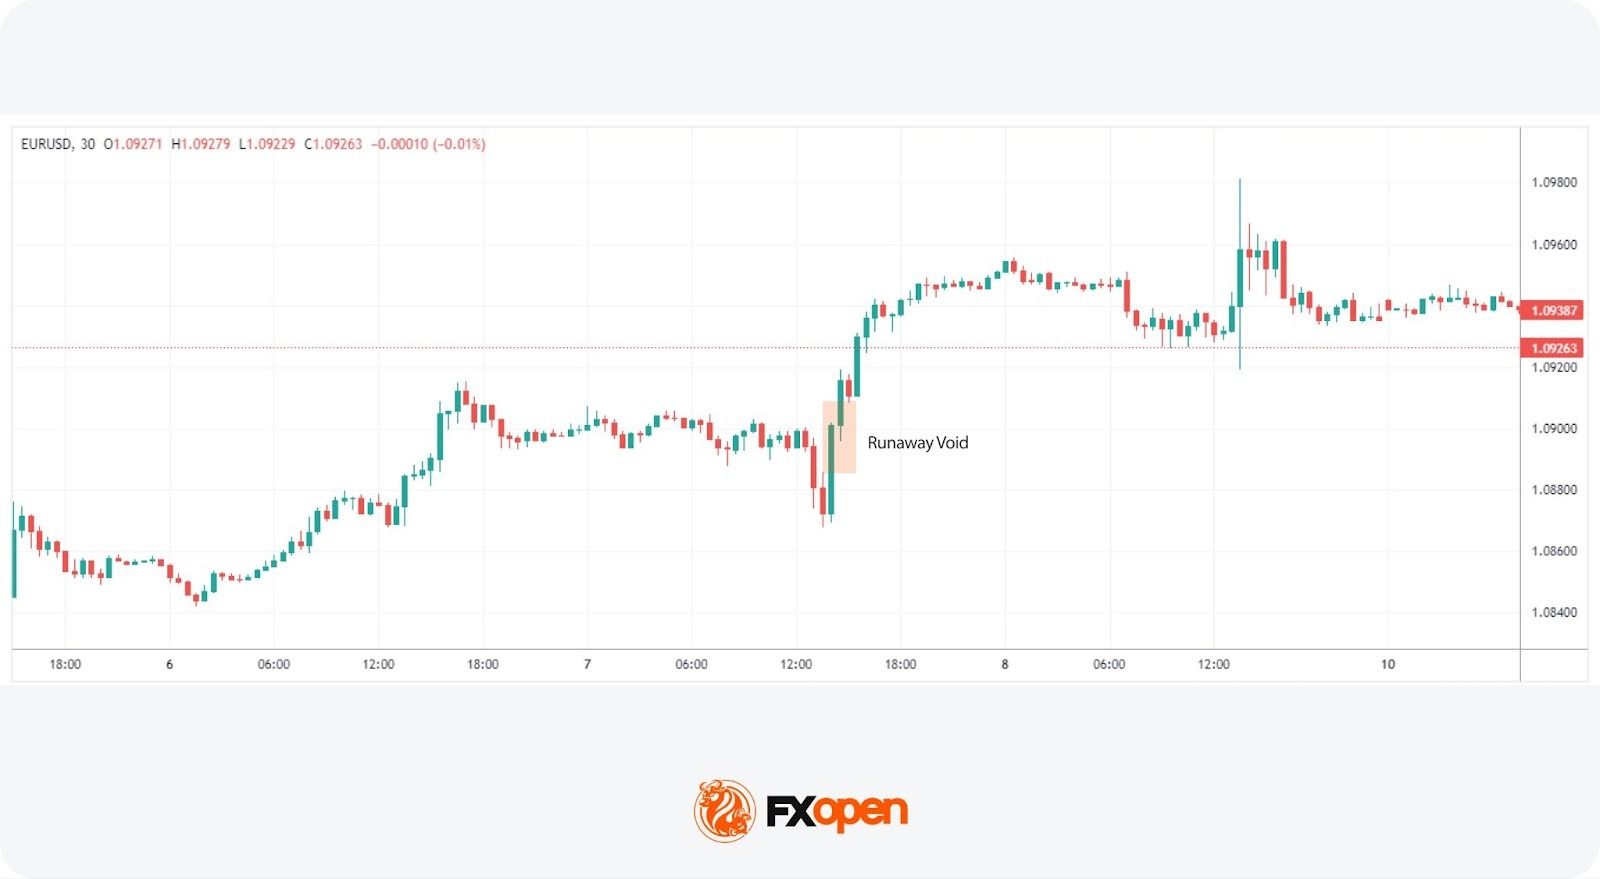
Runaway voids occur within an existing trend and signal its continuation. Price moves sharply in the trend's direction, bypassing levels where liquidity would normally sit, which may support trend strength confirmation.
Liquidity zones and voids form the basis of several common trading approaches. Here's how traders typically work with them.
Traders start by locating areas where price has repeatedly reacted, such as support and resistance levels or high-volume nodes on a volume profile. These clusters of resting orders act as magnets for price.
Rather than acting immediately, traders watch how price behaves when it reaches the zone. Does it stall? Reverse? Push straight through? The reaction tells the story.
A reaction alone isn't enough. Traders look for confirmation through candlestick patterns (like pin bars or engulfing candles) or a shift in market structure, such as a break of a recent swing high or low.
Once confirmed, traders typically set targets at the next liquidity zone or unfilled void. Voids act as areas price is likely to move toward, since they represent unfinished business on the chart.
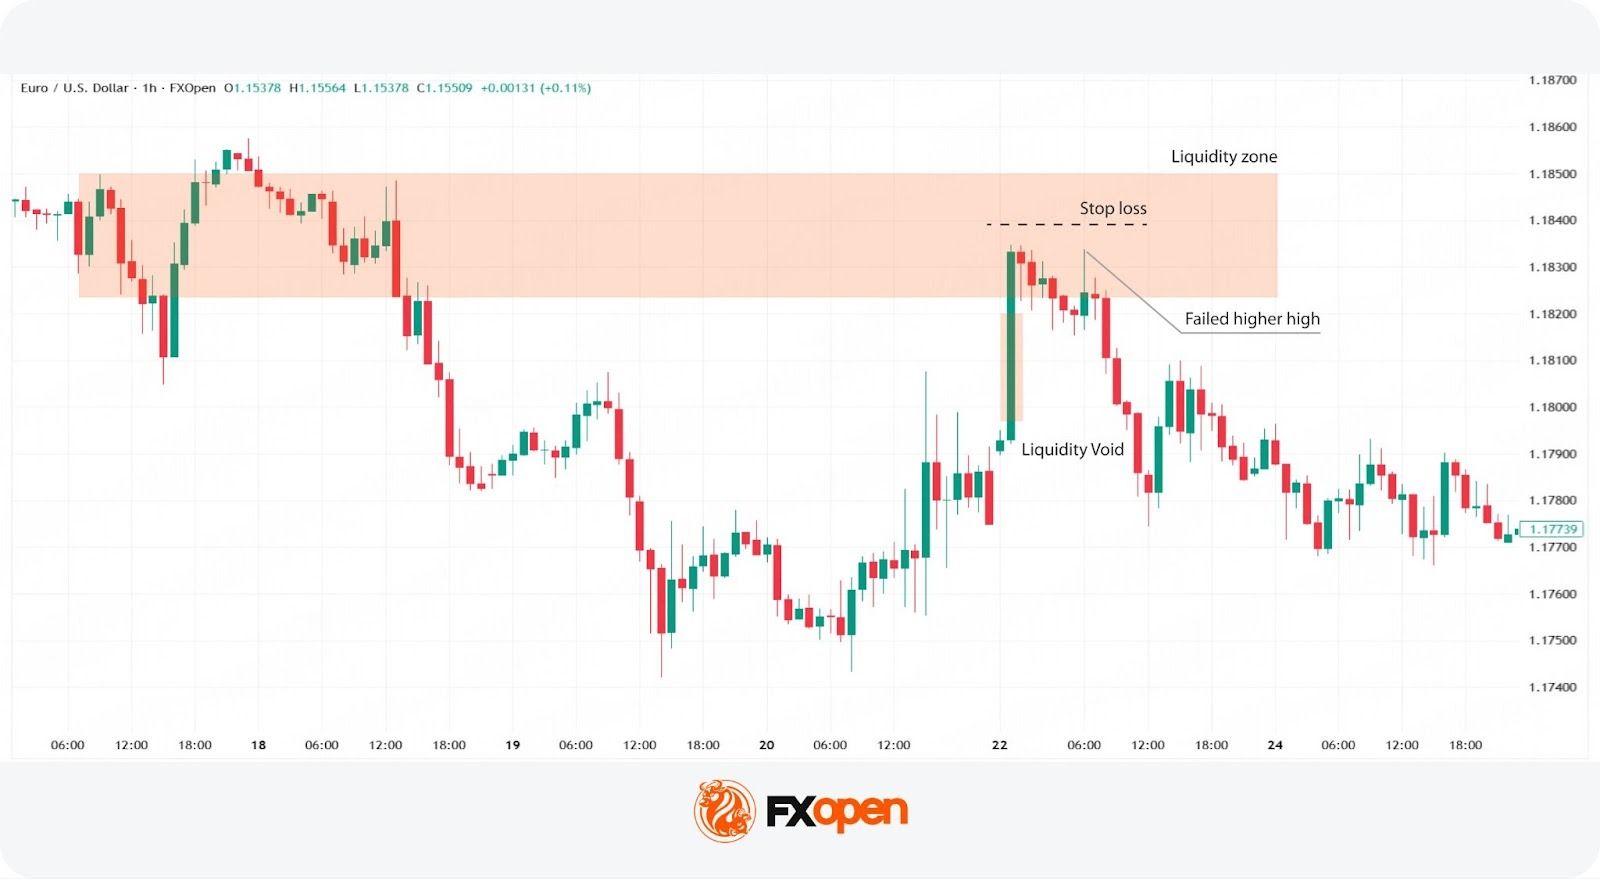
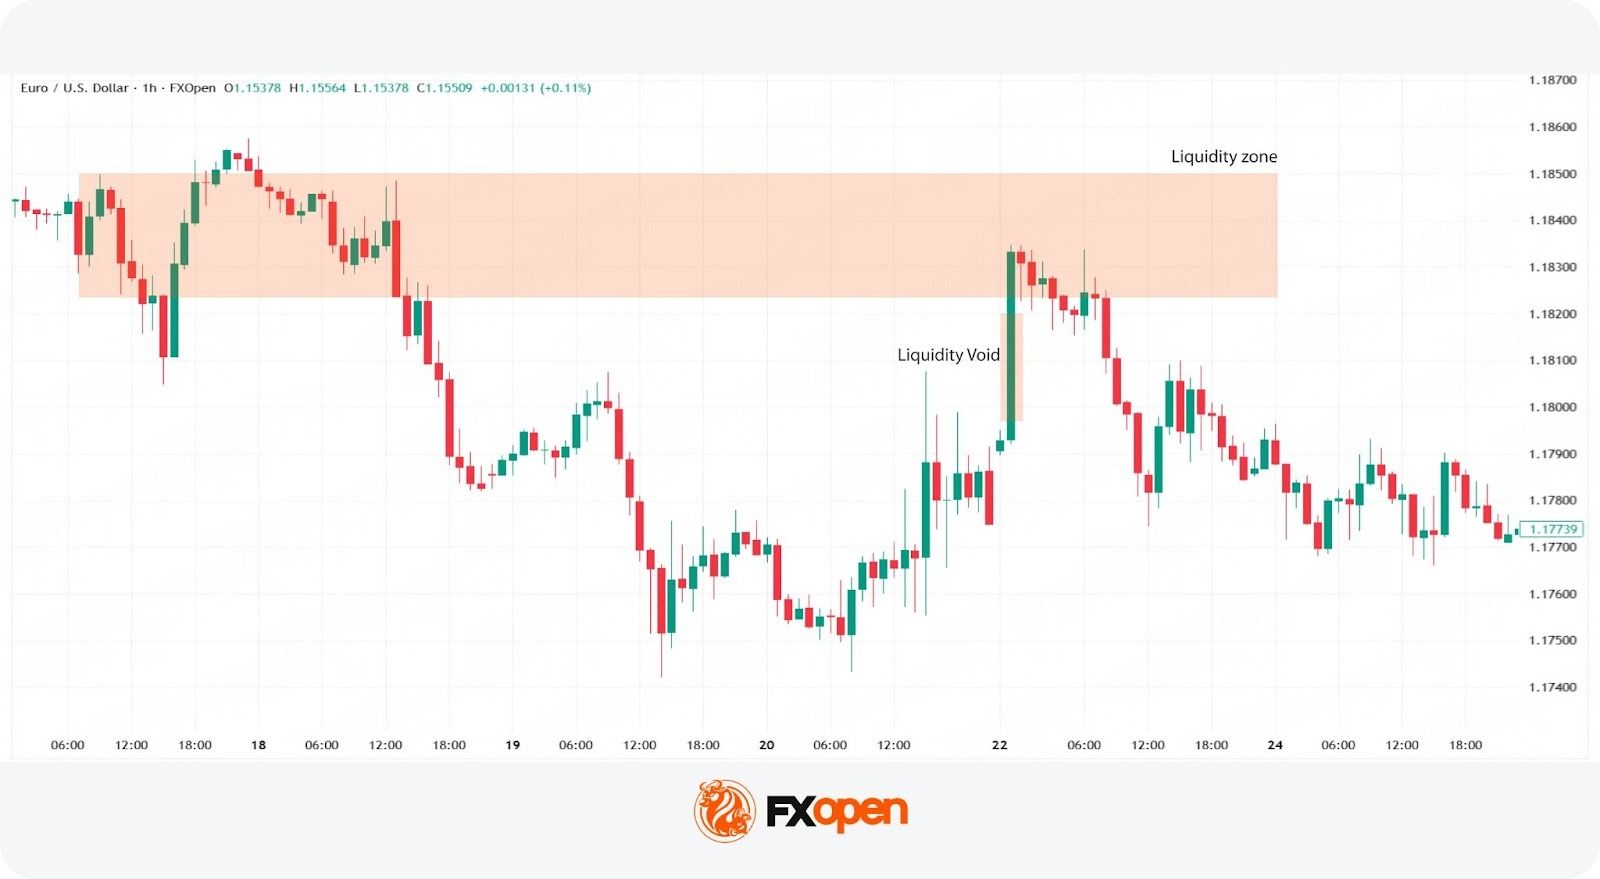
In this example, price moves into a liquidity zone, leaving a void behind it. Buyers attempt to push higher but fail, printing a long upper wick and signalling weakening momentum. Price then breaks below the established low and drops to fill the liquidity void left on the way up. A trader could have opened a sell position after the price broke below the low, set a stop-loss level above the nearest swing high, and closed the trade once the liquidity void was filled.
Understanding liquidity zones and voids provides traders with valuable insights into market dynamics, yet relying solely on these concepts comes with limitations. Here are some specific challenges to consider:
Liquidity zones and voids may help explain how price moves within the forex market. They highlight areas of trading activity and imbalance, offering insight into potential price behaviour.
However, traders use them alongside other tools due to their limitations.
For traders seeking to apply these insights, opening an FXOpen account could provide a practical platform to explore and leverage the dynamics of liquidity in their trading across hundreds of tradable assets.
Liquidity zones are areas on a chart where buy and sell orders are concentrated, often acting as support or resistance. Traders monitor these levels to identify potential entry and exit points.
Liquidity zones are identified using tools such as volume profile, price consolidation, and historical support and resistance. These methods highlight areas where trading activity is concentrated.
Liquidity zones are commonly used to identify potential entry and exit points. Traders monitor price reactions at these levels and may combine them with other tools to refine trading decisions.
Liquidity voids are areas where price moves quickly due to low trading activity, creating an imbalance. Price often returns to these areas to “fill” the gap and restore market balance.

