Mantle (MNT) continues its upward momentum, showing strong bullish signals. As of March 5, 2026, the token climbed 3.01% over the past 24 hours, driven by renewed buying interest and growing confidence among traders.
The weekly performance of MNT remains strong, with a 15.32% surge. Increased market participation and positive investor sentiment fueled this growth, making Mantle one of the most closely tracked tokens, according to CoinMarketCap data.
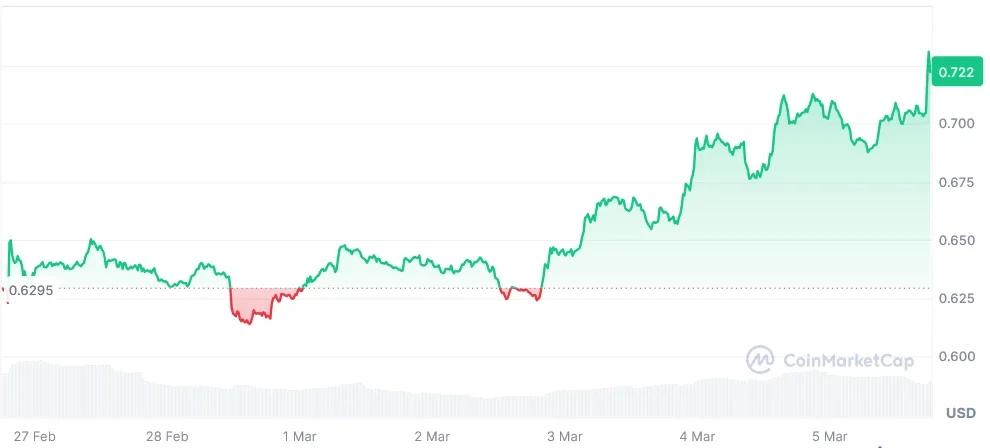
At present, MNT is trading at $0.7253, supported by active market dynamics. The 24-hour trading volume stands at $46.71 million, slightly down by 18.07%, while its market capitalization increased 3.94% to $2.37 billion, reflecting ongoing strength.
Also Read: Mantle (MNT) Technical Breakdown Signals Long-Term Upside Toward $2.60
The MNT daily chart highlights a significant structural shift as the price breaks out from a multi-month falling wedge. This classic bullish reversal pattern suggests the downtrend is ending, with the current price of $0.7041 successfully clearing the primary resistance trendline.
The immediate momentum, however, suggests a recovery, especially after months of consolidation. In order to sustain this, the price should hold its support level at 0.6200. If the buying pressure continues, the price will face resistance at 0.8400, and then a major resistance zone at 1.1000.
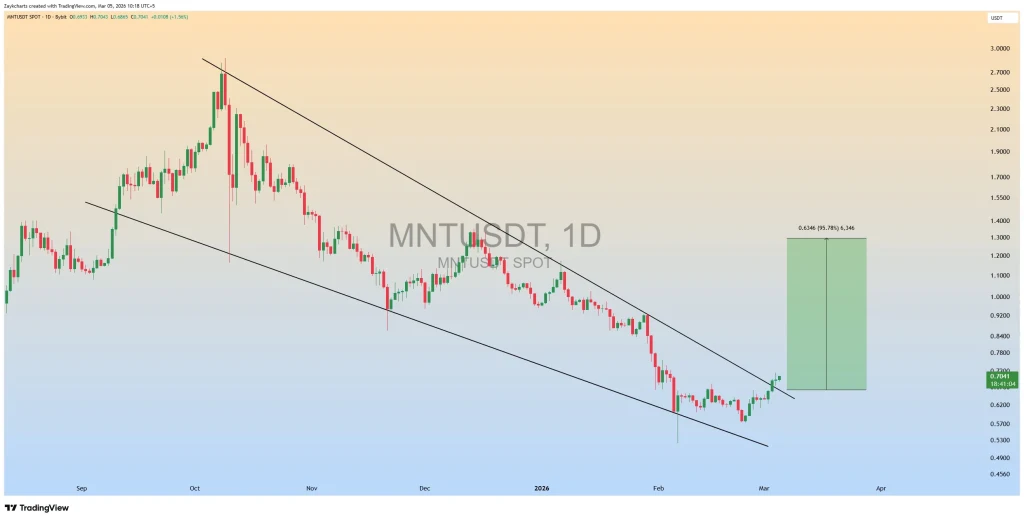
The final technical target for this breakout will be the price level of $1.3300, which will be a potential gain of 95.78% from the price level of the wedge, according to the crypto analyst ZAYK Charts.
Traders will be looking for a retest of the trendline before moving to the green zone, which will be the price level for taking profits.
From the indicator’s side, the RSI is currently at 61.04, and its upward momentum is strong. It has been rising from the oversold area of 30.00 in February and is heading towards the overbought area of 70.00.

The MACD indicator also confirms the uptrend, as the MACD line has crossed above the signal line. The presence of green histogram bars, which have risen to 0.01954, indicates rising buying pressure.
The gap between the two lines has widened, indicating rising momentum in the stock as we move into March.
The interest of investors and traders is particularly focused on the asset, with the technical charts suggesting that the price of the asset could rise to $1.33.
The weekly gains of the asset, along with the breakout charts, are indicative of the increasing interest in the asset.
Also Read: Mantle (MNT) Holds $0.60 Support While Triangle Pattern Signals Volatility Ahea