
MARA Holdings Inc. (MARA) continues its upward trajectory, showing strong momentum as its price has climbed nearly 9.98% over the past 24 hours. The stock is trading at $22.24 with a 24-hour trading volume of $554.9 million, reflecting a 14% increase.
Its market capitalization stands at $8.67 billion, marking renewed investor interest and optimism. Over the past week, MARA has gained 7.1%, reinforcing the bullish trend that began after recovering from its mid-2025 lows.
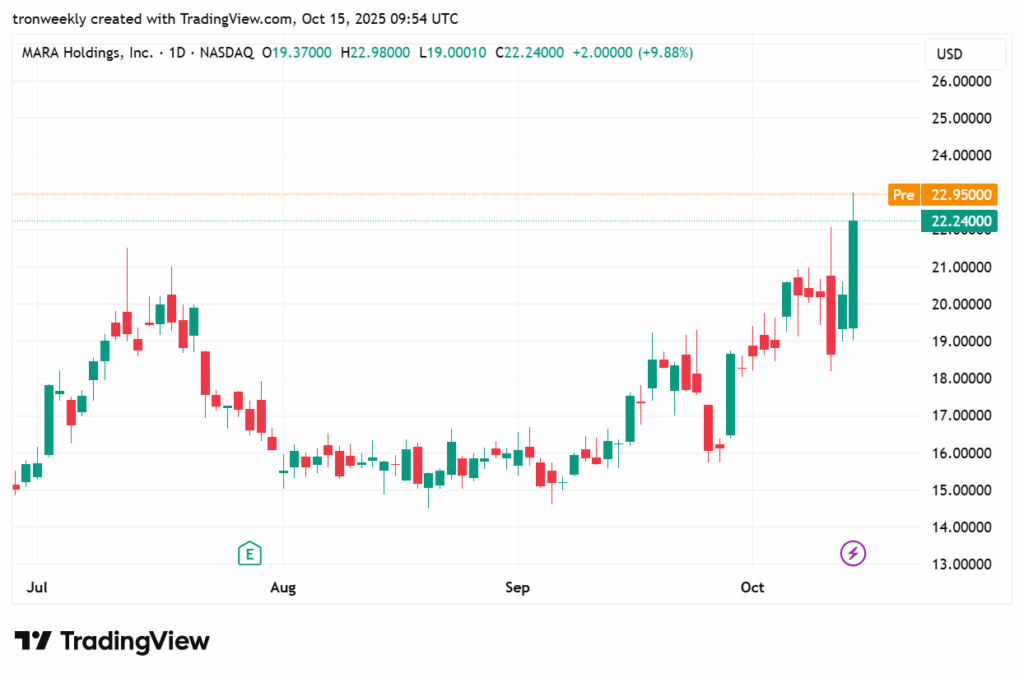
The price action highlights a clear uptrend structure defined by higher highs and higher lows, confirming steady buying pressure. MARA recently broke above the key resistance at $20, which had previously limited upward movement.
Also Read: MARA Price Analysis: Mara Eyes $40 Target After Holding Strong Near $18.42
The next significant resistance lies between $25 and $28, a historically strong rejection zone where previous rallies often stalled. Traders are expected to watch this level closely, as it could prompt short-term profit-taking.
According to crypto analyst Luca, if MARA achieves a clear breakout above this range with strong volume, the next targets could extend toward $30.28 and $32. This progression would indicate continued market strength and confidence in MARA’s long-term growth potential.
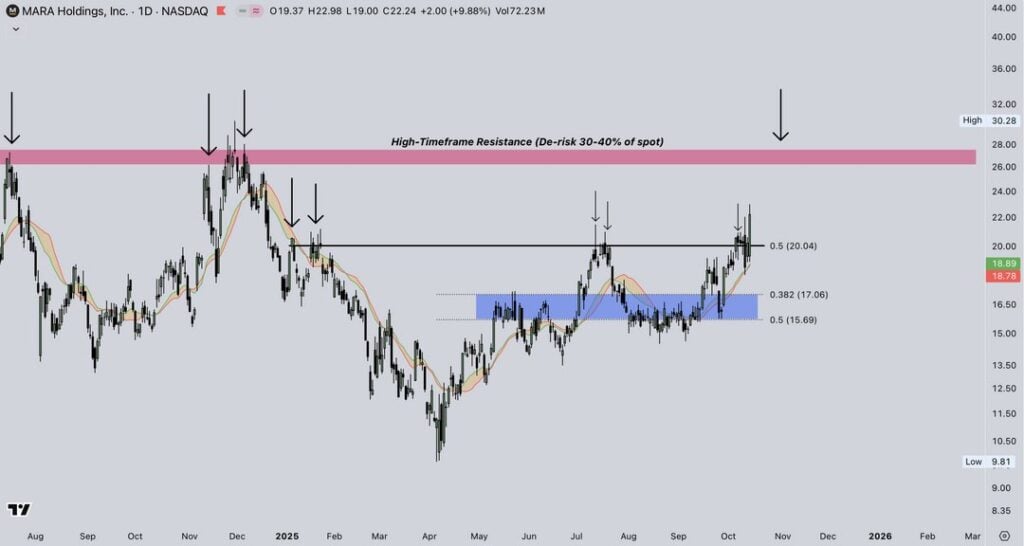
On the downside, near-support resides around $20.04, supported by the 0.5 Fibonacci retracement level and the previous breakout base. If it slips below that level, it may initiate a near-term correction towards $17.06 or $15.69.
However, the token’s larger technical setup remains positive, along with the high-volume accumulation base that fueled its prior uptick. Moving averages are higher in slope, reassuring the fact that bulls remain in control in spite of slightly overbought price levels.
The Moving Average Convergence Divergence (MACD) indicator shows a very strong bullish signal. The MACD line (1.08) is higher than the signal line (0.85), indicating upward momentum, and the histogram is positive and growing, which indicates the bullish momentum is strengthening. This crossover and growing histogram generally indicates increasing buying pressure and the possibility of further appreciation in the near term.
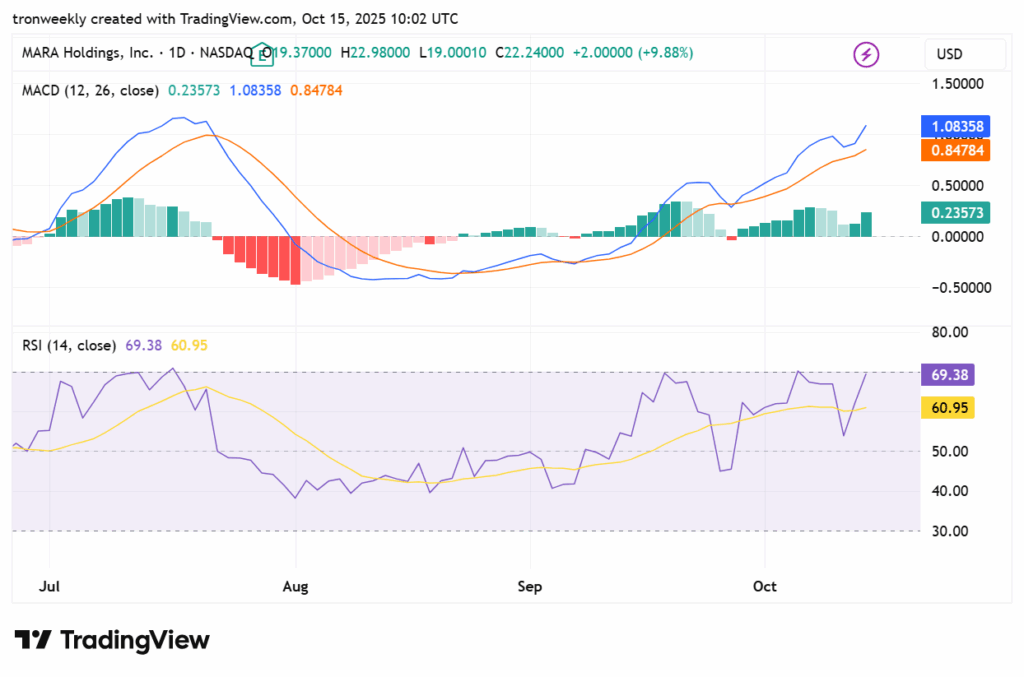
The Relative Strength Index (RSI) is presently standing at 69.38, very slightly below the overbought level of 70. This means the stock is very strongly momentum-oriented but approaching a level where it could become overbought. This doesn’t have to mean a reversal will happen, but it often follows short-term consolidation or a pullback if it moves above 70.
Also Read: MARA CEO Encourages Bitcoin’s Long-Term Growth Strategy


