
Market action shows choppy trading between $21.10 and $21.40 with moderate $1.38 billion volume, highlighting cautious sentiment. A sustained close above $22.02 could trigger recovery toward $24–$26 and possibly $30.43, while failure to defend $20 risks deeper losses toward $18.10.
Chainlink is under pressure after failing to extend gains beyond the mid-$27 resistance zone. The weekly chart shows that the price reversed from this level and is now trading near $21.43, down 6.66% over the last week. The reversal brought the asset close to the upper boundary of the Ichimoku cloud, a key technical area that has acted as a base for rebounds in past trading cycles.
Analyst Joe Mitoshi referred to the current period as a “pivot week,” pointing to a phase where upcoming sessions could define the medium-term price direction. A weekly close above $20.78 would help preserve the bullish structure and potentially create conditions for another move toward $27. A sustained drop below the $20.78–$19.50 zone, however, could expose lower price levels and deepen the consolidation phase.
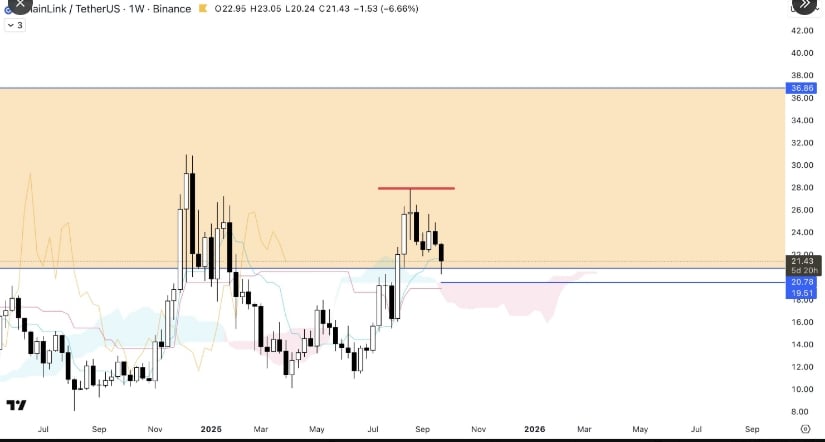
LINKUSDT Chart | Source:x
The price action places the $20.78 and $19.50 levels in focus as immediate supports. These areas coincide with past weekly closes and form the foundation of a broad consolidation range that spans from roughly $20 to $37. Defending these levels is critical for any attempt to regain upward momentum.
If buyers can maintain price stability above $20.78 and gradually push it above $22, the next major target remains the previously tested $27 zone. However, a decisive breakout from that range would open the way toward the longer-term target of $36.86. Conversely, sustained selling could drag the price toward $18, where the next cluster of historical demand sits.
In the shorter timeframe, Chainlink began on September 21, 2025, trading around $22.20 before experiencing a swift pullback to nearly $21.10. Intraday action has since remained choppy, largely holding within the $21.10–$21.40 range. This indicates that the $21 region has thus far provided a buffer against deeper intraday losses, despite a generally weaker sentiment.
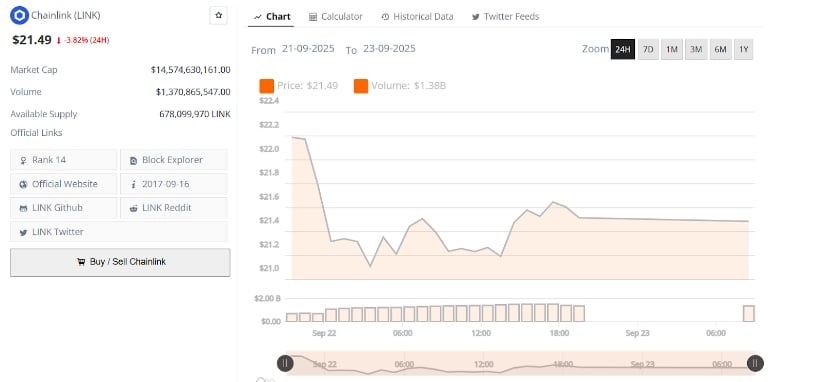
LINKUSD 24-Hr Chart | Source: BraveNewCoin
During the same 24-hour period, trading volume averaged about $1.38 billion, indicating steady market participation without aggressive buying. With Chainlink priced near $21.49 and showing a 3.82% daily decline, traders are watching whether bulls can reclaim the $22 area to signal renewed strength. A clear move above $21.80–$22 could trigger a short-term recovery attempt.
Analyst group CryptoPulse noted that the price drop toward $20 aligns with their projected key demand area. According to their chart analysis, the $20 region coincides with the 0.618 Fibonacci retracement level at $20.58, adding technical weight to the possibility of a rebound. They expect this area to attract buyers who may aim for a move toward $30.43 if the support holds.
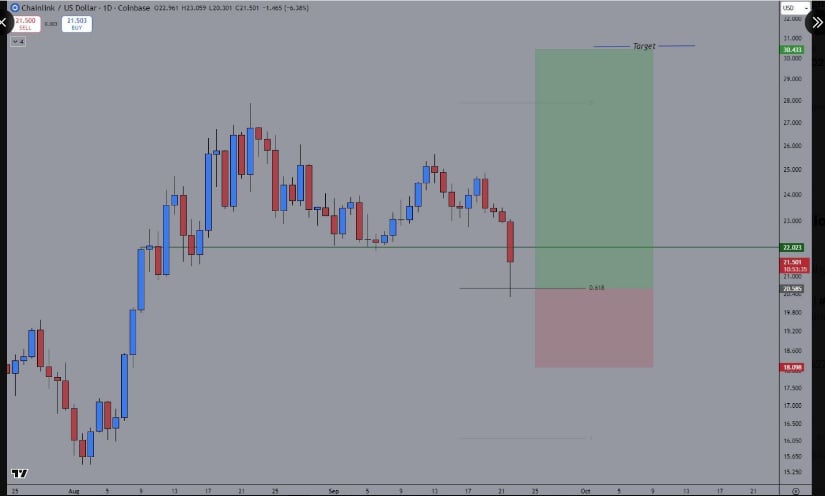
LINKUSD Chart | Source:x
CryptoPulse added that a sustained daily close above $22.02 could confirm buyer strength and clear a path to reclaim the $24–$26 range in the near term. If the $20 support fails, however, the next support is expected near $18.10. Traders are also monitoring derivative metrics such as funding rates and open interest, as a rise in short covering could strengthen an upward move should the key demand zone remain intact.


