
Market analyst Master Kenobi shared an update on what he calls the Bitcoin Master Plan, a long-term model designed to track the digital asset’s market cycles.
This model has earlier predicted the peak before the last cycle, the 2022 trough six months ahead of time, and now indicates the possibility of a market trough in late September or early October if this pattern persists. This part of the cycle follows the halving that took place in April 2024.
As history has shown in terms of Bitcoin’s market cycles, it has always been about halving events, where new coins are reduced in supply. There is a slow buying phase after a halving event and then a huge run-up.
After a peak is reached, there is a sharp drop before a new round of buying begins. Since 2012, there has been a pattern in halvings, price tops, and bottoms.
The preceding cycles show the magnitude of the growth of Bitcoin. In the 2012-2014 cycle, the price increased by more than 54,000% until the peak, 367 days after the halving.
Thereafter, the price dropped by 86%, forming a trough 410 days after the peak. In the 2016-2018 cycle, the same pattern repeated but with smaller gains.
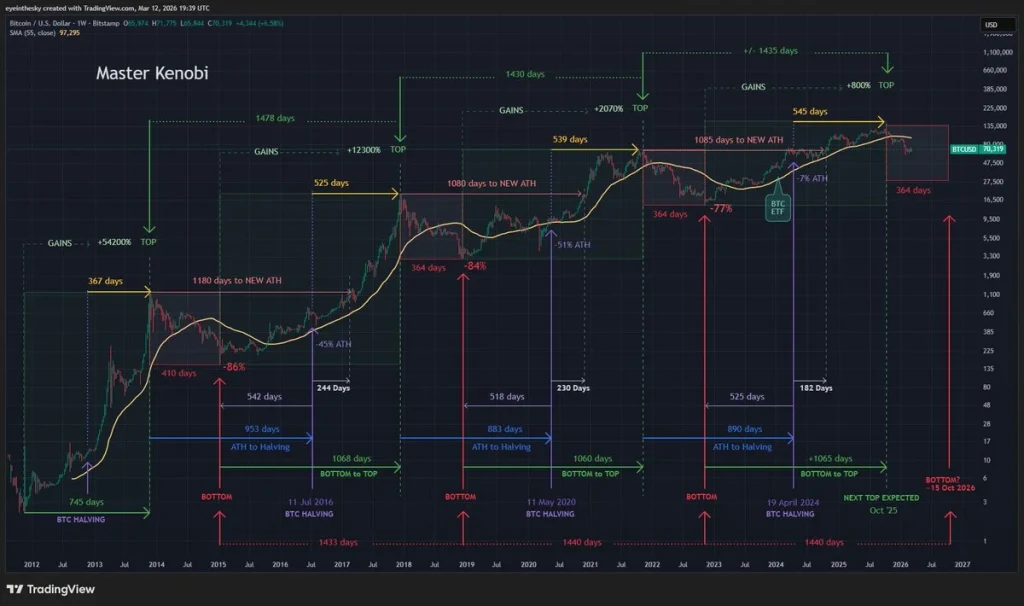
After the July 2016 halving, the price peaked 525 days later, increasing by 12,300%. After the peak, the price dropped by 84% over 364 days to form a trough by the end of 2018.
The last completed cycle was from 2020 to 2022. Following the halving event in May 2020, the time taken for the price to reach the all-time high was 539 days. The rally saw a gain of 2,070% from the trough to the peak.
However, the price declined by 77% from the peak as the price corrected for nearly a year. The chart also depicts the 55-week moving average. In the past, Bitcoin tested the level before making a move to the peak.
Also Read: Bitcoin’s $74K Challenge: PCE Inflation Data Fuels Market Resurgence
While the cycle model indicates a possible peak in October 2025, other theories look at the timing of the market in relation to previous highs.
On March 13, a market expert known as Crypto Tice stated that Bitcoin had entered its historical bottom window. This is based on the time lag between major peaks and the eventual market bottom.
His data indicates that previously, bottoms in the Bitcoin price occurred about 23 months after Bitcoin reached its all-time high. Currently, we are in that same time window.
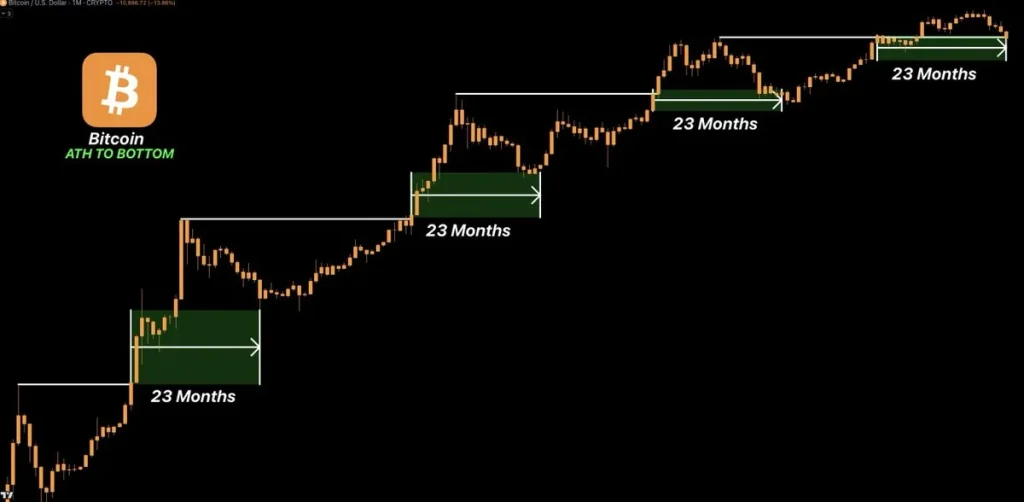
He pointed out several major signs that are coming into play at the same time, such as a lack of downward momentum, a lack of selling, low volatility, and a change in the cycles of liquidity. When these factors come into play, they have previously indicated a major turn in the market.
This article contains market analysis and price predictions. These are not guarantees. Crypto markets are volatile. Always DYOR. Not financial advice.
Also Read: Bitcoin Holds Above $70K as Analysts Warn Volatility Could Signal Cycle Peak


