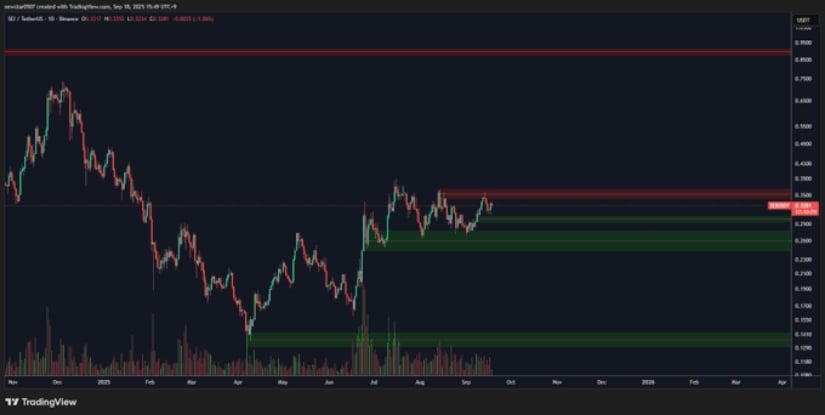
Market structure highlights a symmetrical triangle formation, hinting that the coin is on the verge of a decisive breakout. A close above this barrier could reshape sentiment and set the stage for accelerated buying momentum in the coming sessions.
The trading structure shows SEI consolidating near $0.33, just below the $0.35 level that has emerged as a major sell wall. Multiple prior attempts to clear this zone have been met with immediate selling pressure, reinforcing its importance as a resistance point. If this ceiling gives way, analysts expect a sharp price reaction fueled by buyers who have been accumulating during the current consolidation.
Source: X
The ongoing pattern reflects a tightening range, with price oscillating between $0.28 support and $0.35 resistance. This narrowing structure aligns with the characteristics of a symmetrical triangle, a setup that often precedes significant market moves. A confirmed breakout would validate bullish expectations, while failure to breach resistance could force another retest of lower demand zones.
According to BraveNewCoin data, SEI is priced at $0.33, reflecting a 4.75% increase in the last 24 hours. Its market capitalization stands at approximately $2.03 billion, placing it within the mid-cap range of digital assets.
Trading activity has also been notable, with daily volumes of around $212 million, underscoring active participation from buyers and sellers. This level of engagement points to a market that is both liquid and responsive to shifts in sentiment.
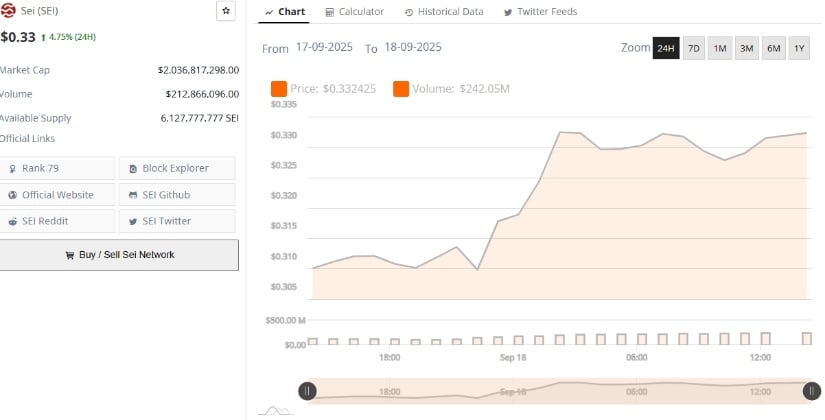
Source: BraveNewCoin
The available supply of 6.12 billion tokens adds context to its valuation, as the large circulating base allows for broad distribution but also means that price appreciation relies heavily on sustained demand.
The 24-hour price range between $0.29 and $0.34 shows how buyers have been consistently defending lower levels while testing the strength of higher resistance. Maintaining this balance is crucial, as it sets the foundation for a potential breakout above the highlighted $0.35 sell wall.
Momentum indicators are showing signs of improvement, further supporting the bullish thesis. The MACD line has edged above the signal line with a modest positive histogram, suggesting the early stages of upward momentum. Although still fragile, this crossover is a constructive development, pointing toward strengthening sentiment.
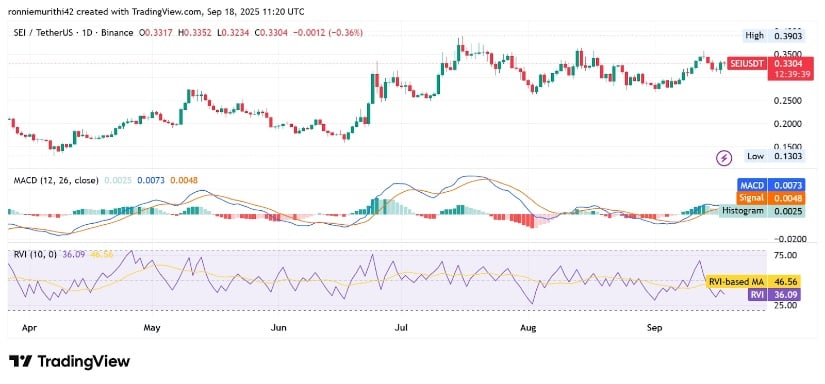
Source: TradingView
Meanwhile, the Relative Volatility Index (RVI) currently reads near 61, with its moving average at 49. This reflects growing buying strength without indicating overbought conditions, suggesting that SEI still has room for expansion if momentum continues. Traders often view such setups as precursors to more sustainable rallies, particularly when aligned with chart patterns like the symmetrical triangle.
At press time, the token trades at $0.33, up 4.75% in the past 24 hours, with a market capitalization of $2.03 billion and trading volume of $212 million. A decisive close above $0.35 would confirm the breakout pattern, potentially opening the path toward $0.45 and eventually $0.60 in the medium term. Until then, the coin remains in consolidation, with market participants closely monitoring whether the sell wall will finally be broken.