
MemeCore (M) has been moving sideways in recent weeks, with the price currently around $1.69. After a period of decline, the token is now showing early signs of stabilization, trading in a narrow range between support and resistance. The chart suggests that MemeCore may be forming a short-term consolidation pattern, sometimes referred to as a rectangle or range-bound structure, where the price oscillates between defined support and resistance levels.
Over the past 24 hours, the price of this memecoin climbed about 3%, reaching an intraday high of $1.71 and a low of $1.62. Its market cap currently stands at $2.1 billion, with a trading volume of $14.7 million.
Looking at the 24 hours trading pattern, MemeCore is positioned between the 50-day moving average at $1.555 and the 100-day moving average at $1.889. The 50-day moving average is slowly flattening, indicating that immediate selling pressure is easing. The 100-day moving average remains above the current price, suggesting the broader trend is still slightly weak. Overall, the averages show that the market is in a recovery phase but hasn’t fully returned to an uptrend yet.
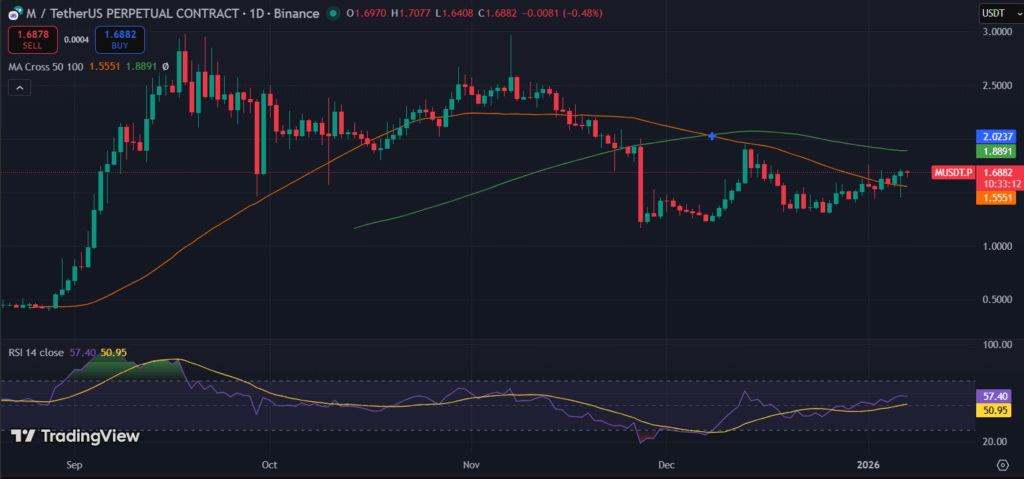
MemeCore’s daily RSI stands at 57, showing that momentum is mildly positive. This indicates that buyers are gradually returning, but there isn’t a strong push higher yet. The market isn’t oversold or overbought, which fits with the sideways price action seen on the chart.
Immediate support is around $1.55–$1.56, which has helped prevent further declines in recent sessions. A stronger support level exists near $1.50, which could provide a safety net if the price dips further. On the upside, MemeCore’s resistance is seen at $1.89, near the 100-day moving average, followed by $2.02, which previously acted as a barrier. Breaking above these levels would be necessary for any meaningful upward movement.

