
Momentum is slowly building, hinting that the asset could be gearing up for a renewed push higher. Traders are watching closely for signs that this steady base could launch a new rally toward the $11 mark.
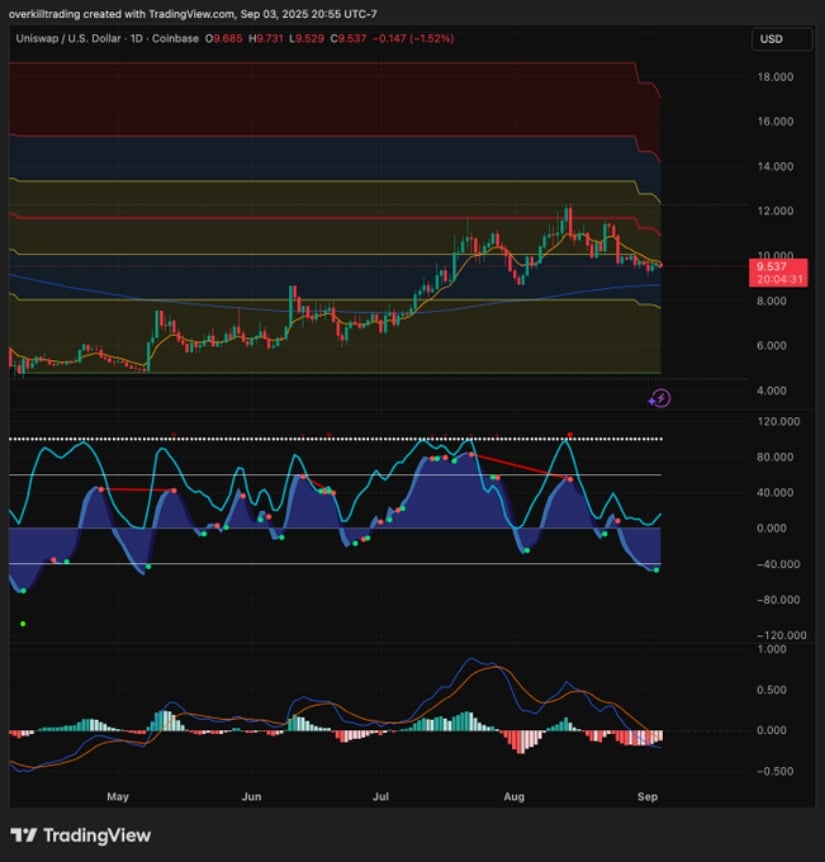
Analyst Overkill Trading (@OverkillTrading) recently noted that UNI exchange has been consolidating on the daily chart, forming a base just above $9.50. This level is reinforced by the 200-day moving average near $9, providing much-needed support amid recent selling pressure.
Despite facing resistance at local highs around $12, the token shows resilience as buyers defend this area, suggesting the longer-term bullish trend is far from broken.
Source: X
The momentum indicators paint a mixed but hopeful picture. The stochastic oscillator is bouncing from oversold levels, implying a potential recovery if buyers gain follow-through. Yet, lower highs on the oscillator reveal lingering bearish pressure that might slow gains in the short term.
Meanwhile, the MACD still signals bearish momentum, but shrinking histogram bars point to a possible slowdown in selling, setting the stage for a bullish turn if buying picks up. A break back above $10.50–$11.00 would be the next major milestone for bulls to target.
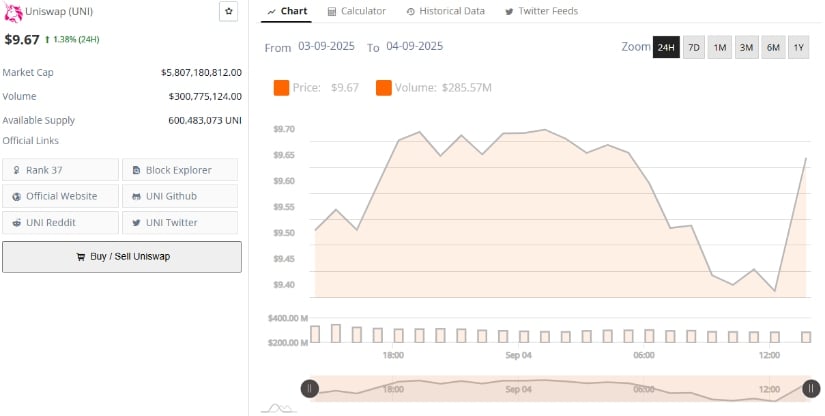
According to BraveNewCoin, data confirms this cautious optimism: UNI exchange is trading around $9.67, up a modest 1.38% over 24 hours. Price action showed a push toward $9.70 before settling back slightly, reflecting active but balanced trading.
The market cap stands strong at about $5.8 billion, with daily volume hovering over $300 million, signaling steady participation from buyers and sellers alike.
Source: BraveNewCoin
Over the past day, the memecon exhibited some short-term volatility, with the price swinging between $9.40 and $9.70. This range-bound movement suggests profit-taking and renewed buying are coexisting as the market awaits a clearer direction.
Holding firm above the $9.40–$9.50 area is crucial for maintaining bullish ambitions, while breaking below could open the door for a deeper pullback toward $9.20. The current balance in volume and price action points to a market ready for its next move.
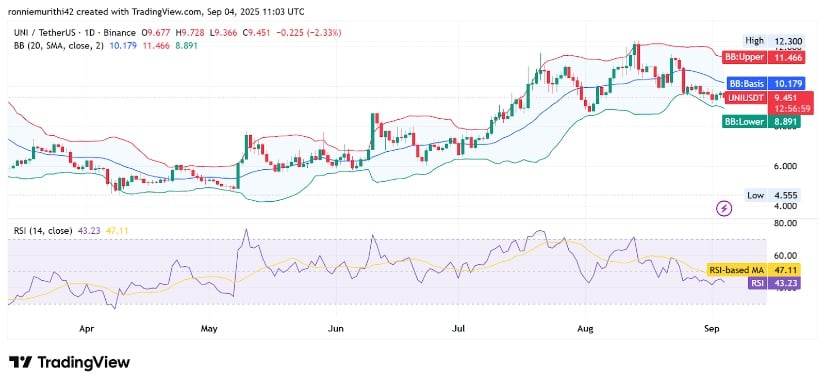
Looking at the TradingView daily chart, UNI trades just below the 20-day moving average around $10.17, consolidating within the Bollinger Bands, which stretch from about $8.89 to $11.46.
The price action is leaning slightly lower, and if bearish pressure continues, a trip back toward the $8.90 support zone is possible. But a bounce above $10.20 would signal renewed buying and could reopen the path to upper resistance levels.
Source: TradingView
The Relative Strength Index (RSI) around 43 shows that buying power has softened, with sellers gaining some ground, though not overwhelmingly. The RSI’s downward trend, combined with its position below the neutral 50 level, suggests caution buyers need to regroup to prevent a further slide.
However, this cooling off could also lay the groundwork for the next upward push if momentum indicators turn positive and volume supports the move.

