
NEAR Protocol (NEAR) trades lower on March 22, 2026, as renewed selling pressure pushes the token down nearly 2.3% over the past 24 hours.
The decline highlights short-term weakness, with traders monitoring whether current levels can hold amid shifting momentum. The token is priced at $1.28, reflecting a 5% weekly drop, according to CoinMarketCap data.

Despite the downturn, trading volume has climbed to $115.55 million, showing active participation, while market capitalization stands at $1.65 billion as broader market activity continues to evolve.
Also Read: NEAR Protocol Price Crashes Below $1.42 Support: Potential 30% Decline Looms
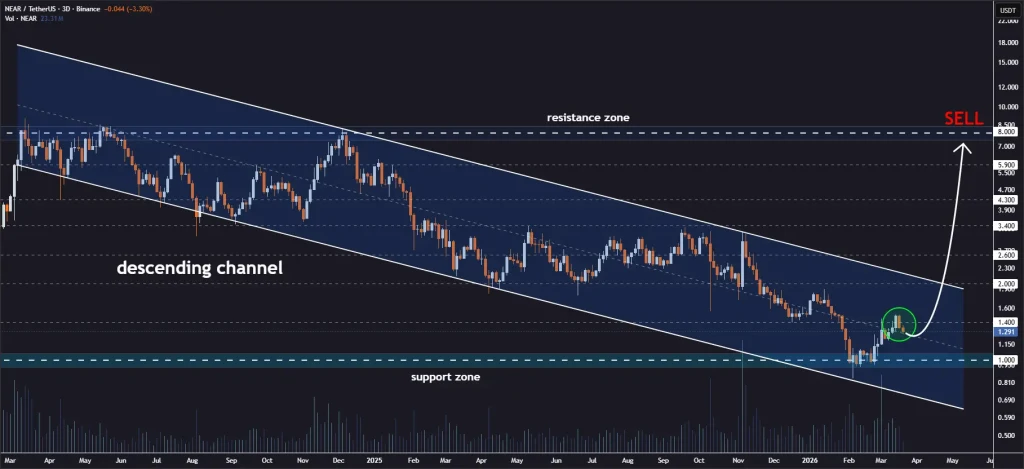
According to the crypto analyst, Jonathen Carter, the 3D chart of NEAR shows price actively retesting the breached midline of a long-term descending channel.
This level now acts as a key support-resistance flip zone, making it critical for confirming whether the bullish breakout remains valid or fails under selling pressure.
This is the retrial phase, which is crucial to confirm the trend. If the buyers hold the midline well, then the case for the reversal is stronger.

However, if the price is rejected at the current level, then the price may fall back to the lower boundary of the channel once again, keeping the downtrend intact.
A strong bounce could create upward momentum, taking the price to several resistance marks. The immediate price targets will be $2.00, $2.60, $3.40, and $4.30.
If the momentum continues, the price could be on its way to higher targets, such as $5.90 and $8.00, matching some major historical resistance within the channel.
From an indicator perspective, the RSI is also weakening, with momentum slowing down from its peak. Currently, the RSI is at 49.75, whereas the signal line is at 58.07.
This shows that there is a rise in bearish pressures. It is suggested that there might be a consolidation phase in the near future, as the momentum goes below the 50 mark.
The MACD signal is weakening and indicates a decrease in bullish power, with a sliding histogram moving into negative territory.
The MACD line at -0.01041 is falling below the signal line at 0.03743, and a weakening histogram at 0.04784 is losing its power; a bearish crossover may occur.
This retest level will indicate whether NEAR has the momentum for a bullish breakout or if it will continue to fall into the broader downtrend.
If the price falls below this level, it is expected that there will be more pressure on the price, and traders will become more cautious.
This article contains market analysis and price predictions. These are not guarantees. Crypto markets are volatile. Always DYOR. Not financial advice.
Also Read: Near Protocol (NEAR) Tests $0.954–1.18 Support as Pressure Builds

