
Official Trump (TRUMP) surged more than 6.50% on Saturday, March 14, after breaking above a major resistance level. The increased volume and improved technical indicators suggest that the buying activity is increasing.
At the time of writing, TRUMP was trading near $3.95, with a 24-hour trading volume of $4.04 billion and a market capitalization of $935.74 million, according to market data from CoinMarketCap.

On March 14, 2026, crypto market analyst Alpha Crypto Signal highlighted that Official Trump (TRUMP) recently broke through an important horizontal resistance level, which had been preventing the price from moving in the past few days. The breakout was accompanied by an increase in trading volumes, which is considered a sign of rising demand.

Once the price moves past this level, the token is trying to test the previous resistance level as support. According to Alpha Crypto Signal, retaining this level is essential, as it confirms the support level, thus strengthening the bullish structure of the trend.
As long as TRUMP holds its place above the breakout zone, it could pave the way for a continuation of positive momentum in the short term. A move back below this level might indicate a failed breakout attempt, leading to a correction in values.
Another factor that indicates that the market strength for the token is improving is the technical indicators. The Relative Strength Index (RSI) for the token has risen to 67.52, reflecting high buying pressure after the recent price rebound.
The token is currently trading above its 20-day moving average price of $3.30 and its 50-day moving average price of $3.63. This indicates a shift in short-term momentum to the buyers’ side.
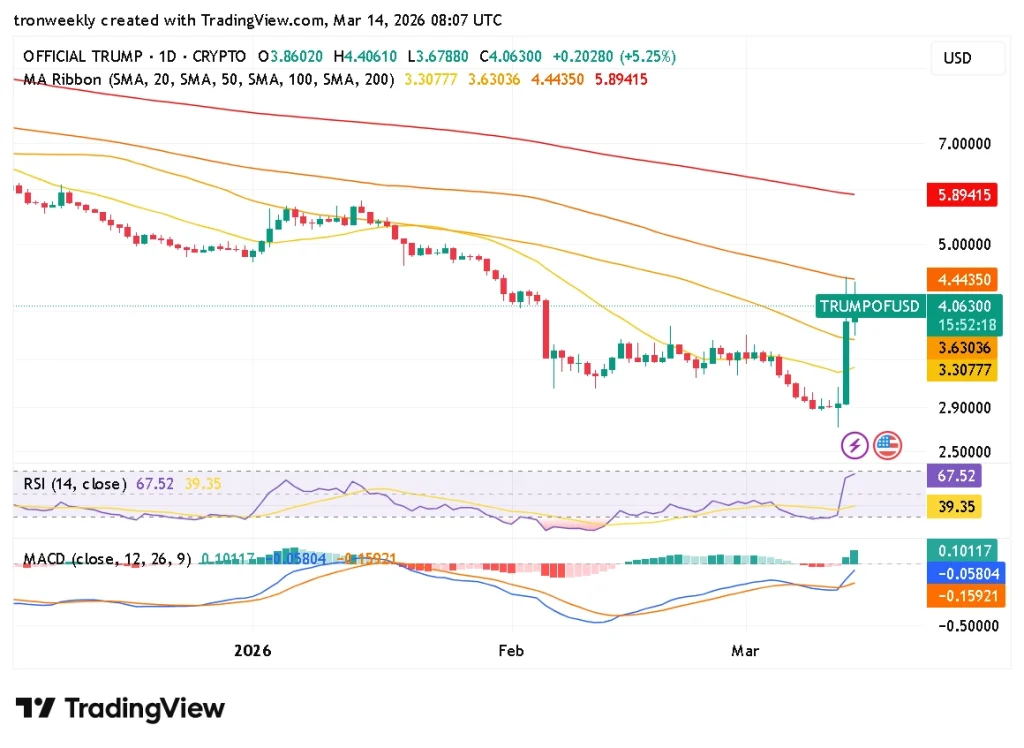
Despite the recent gain, the stock is still challenged by longer-term technical levels. The stock remains under the 100-day moving average around $4.44 and the 200-day moving average around $5.89, and the trend needs further confirmation for a long-term recovery.
Also Read | LayerZero Becomes Multi-Chain Backbone While ZRO Faces Resistance at $2.20
The MACD indicator is showing a bullish sign as the MACD line crosses above the signal line. The MACD line itself is at 0.101, while the signal line is at -0.058. The histogram is showing a bullish sign as it is positive at 0.159.
However, if the buying pressure continues and the token holds up above the breakout, analysts claim that the rebound could be a stronger TRUMP.
This article contains market analysis and price predictions. These are not guarantees. Crypto markets are volatile. Always DYOR. Not financial advice.
Also Read | Bitcoin Cycle Model Reveals Powerful 2025 Peak Timeline in 3 Signals

