On 16 September, we noted signs of a strong market for Tesla (TSLA) shares, including:
→ The price remaining above the psychological level of $400;
→ Reaching the highest levels since late January.
We also identified an ascending channel and suggested that the long-term outlook remained optimistic, although a correction could not be ruled out.
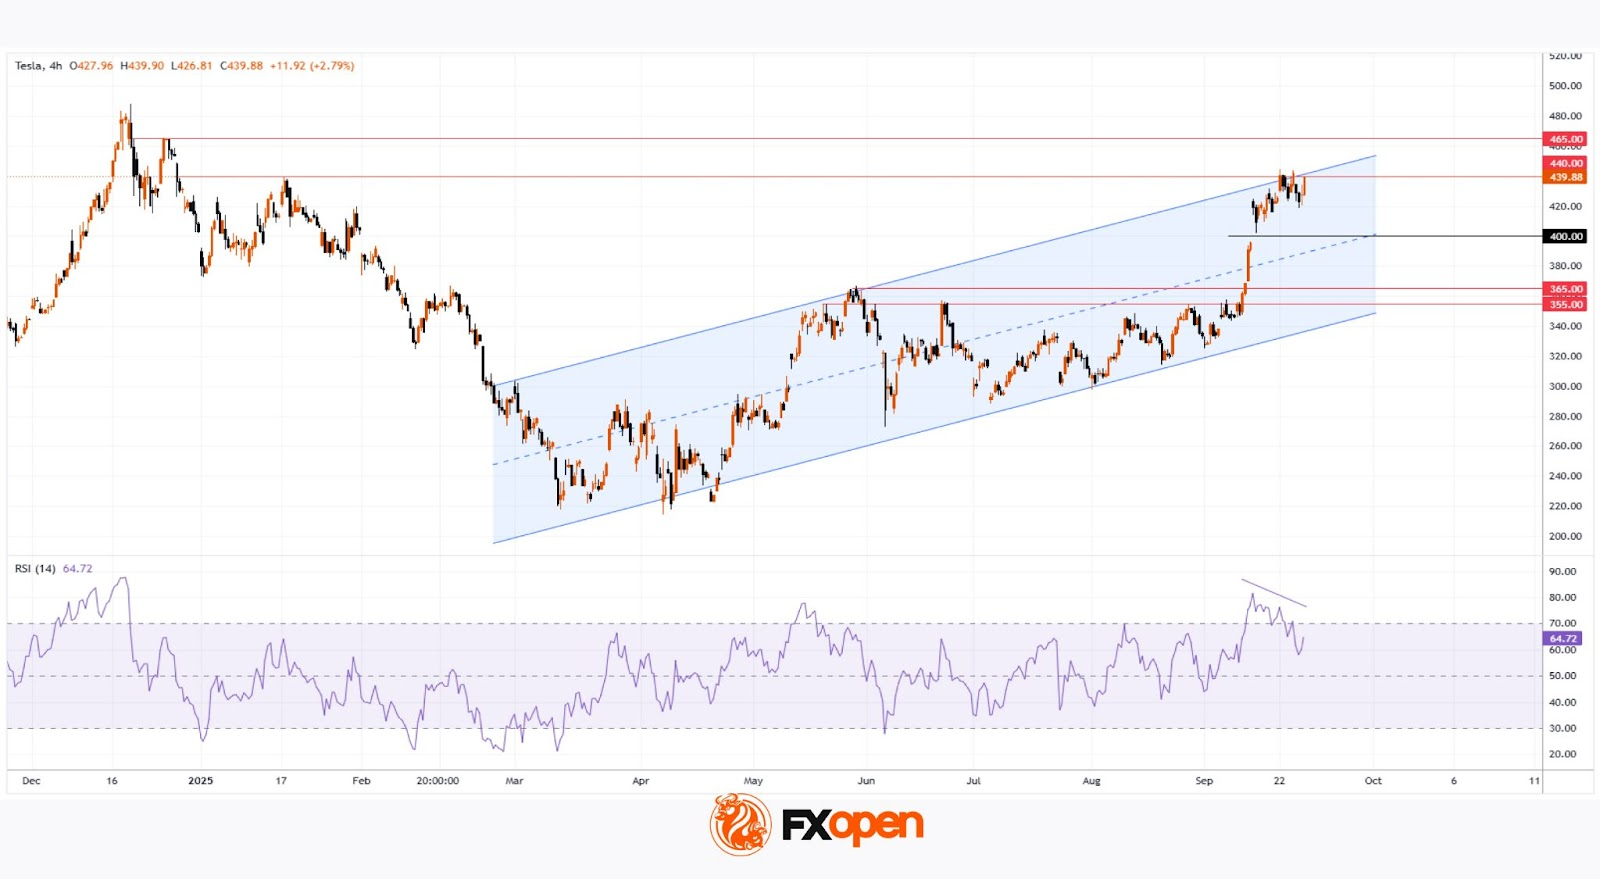
Since then, TSLA shares have stabilised near the upper boundary of the channel, holding above the $400 level. On Friday, they were among the market leaders, rising by more than 4%. This brings the gain since the start of September to around +30%.
Why Are TSLA Shares Rising?
Key factors supporting a bullish outlook include:
→ Sentiment ahead of the quarterly Production and Deliveries report, expected this week. According to recent forecasts, actual figures could exceed expectations (although still showing a decline compared to the previous year).
→ Target price upgrades. Dan Ives of Wedbush, one of Tesla’s most prominent bulls, last week raised his target price to $600 — the highest on Wall Street — citing substantial potential in AI and robotaxi development.
→ The “Musk factor”: Discussions around Elon Musk stepping away from politics are seen as a long-term positive driver.
Technical Analysis of TSLA Shares
The ascending channel remains intact. However, the chart suggests that the upper boundary now acts as resistance — unsurprising given the exceptional gains in September (noting that TSLA’s price has doubled since its yearly low). A slowdown in momentum is signalled by a bearish divergence on the RSI indicator.
Resistance at the upper boundary is further reinforced by a strong bearish reversal from late 2024. A similar pattern was recently observed when the price struggled to break above the bearish reversal zone at $345–355, resulting in an extended sideways movement in August and early September.
By analogy, the $445–465 zone may also act as resistance — meaning a correction remains a plausible scenario. For example, TSLA stock price could pull back to test the psychological $400 level, which is supported by the median of the current channel.

